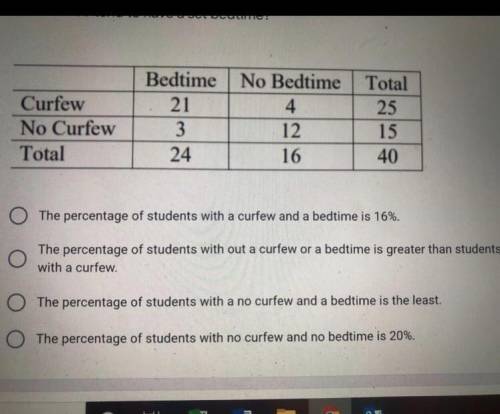
Use relative frequencies calculated for rows or columns to describe
possible association
bet...

Mathematics, 07.02.2021 21:40 masie03
Use relative frequencies calculated for rows or columns to describe
possible association
between the two variables, Jeremy asked a sample
of 40 8th grade students whether or not they had a curfew. He then
asked if they had a set bedtime for school nights, He recorded his data in
this two-way frequency table. Is there evidence that those who have a
curfew also tend to have a set bedtime?
Help ASAP I’ll mark brainliest


Answers: 2


Another question on Mathematics


Mathematics, 21.06.2019 20:30
Find the magnitude, correct to two decimal places, made by each of the following with positive direction of the x axis a) y= x the answer is 45° but i don’t know how
Answers: 2

Mathematics, 21.06.2019 21:00
The sum of the first eight terms of an arithmetic progression is 9m + 14. the fifth term of the06 progression is 2m - 6, where m is a constant.given that the first term of the progression is 26,find the value of the common difference, d and thevalue of m.
Answers: 1
You know the right answer?
Questions

Mathematics, 21.03.2021 09:10

Chemistry, 21.03.2021 09:10


Mathematics, 21.03.2021 09:10

English, 21.03.2021 09:10


Mathematics, 21.03.2021 09:10

English, 21.03.2021 09:10


Mathematics, 21.03.2021 09:10

Mathematics, 21.03.2021 09:10


Mathematics, 21.03.2021 09:10


Social Studies, 21.03.2021 09:10


History, 21.03.2021 09:10

Physics, 21.03.2021 09:10


