
Mathematics, 08.02.2021 01:00 trintrin227
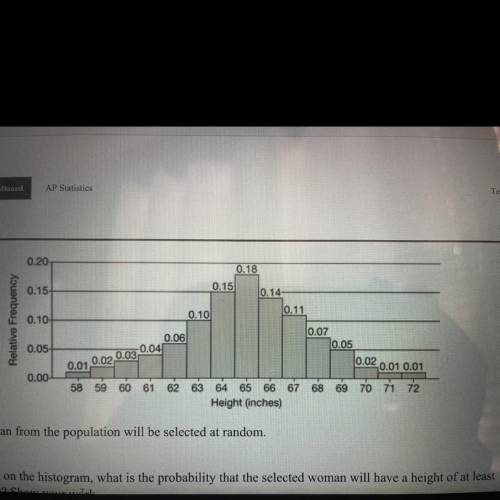
The histogram displays a discrete probability model for height. However, height is often considered a continuous variable that follows a normal model. Consider a normal model that uses the mean and standard deviation of the population of women as its parameters.
b.) What is the area of the bar corresponding to a height of 67 inches in the graph, and what does the area represent in terms of probability?
c.) Use the normal model and the relationship between area and relative frequency to find the probability that the randomly selected woman will have a height of at least 67 inches. Show your work.

Answers: 1


Another question on Mathematics
Mathematics, 21.06.2019 17:00
The size of a certain cell is 2.5*10^-9m. another cell is 1.5*10^3 times larger. how large is the larger cell in scientific notation?
Answers: 2
Mathematics, 21.06.2019 20:00
Which expression is rational? 6. , square root two, square root 14, square root 49
Answers: 1
You know the right answer?
The histogram displays a discrete probability model for height. However, height is often considered...
Questions
Mathematics, 20.11.2019 23:31
Mathematics, 20.11.2019 23:31


French, 20.11.2019 23:31
History, 20.11.2019 23:31

Geography, 20.11.2019 23:31
History, 20.11.2019 23:31
History, 20.11.2019 23:31
Geography, 20.11.2019 23:31


