Which best describes the association shown in the scatter plot?
A. no association
B. strong p...

Mathematics, 08.02.2021 22:10 gobbler80
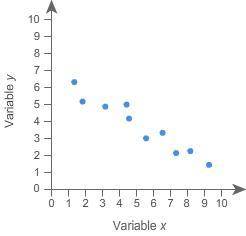
Which best describes the association shown in the scatter plot?
A. no association
B. strong positive
C. moderate positive
D. strong negative

Answers: 1


Another question on Mathematics
Mathematics, 21.06.2019 19:00
The reflexive property of congruence lets you say that ∠pqr ≅
Answers: 1
Mathematics, 21.06.2019 20:30
26) -2(7x) = (-2 • 7) x a. associative property of addition b. associative property of multiplication c. commutative property of multiplication d. commutative property of addition
Answers: 1
Mathematics, 21.06.2019 20:30
3.17 scores on stats final. below are final exam scores of 20 introductory statistics students. 1 2 3 4 5 6 7 8 9 10 11 12 13 14 15 16 17 18 19 20 57, 66, 69, 71, 72, 73, 74, 77, 78, 78, 79, 79, 81, 81, 82, 83, 83, 88, 89, 94 (a) the mean score is 77.7 points. with a standard deviation of 8.44 points. use this information to determine if the scores approximately follow the 68-95-99.7% rule. (b) do these data appear to follow a normal distribution? explain your reasoning using the graphs provided below.
Answers: 1
Mathematics, 21.06.2019 23:00
Unaware that 35% of the 10000 voters in his constituency support him, a politician decides to estimate his political strength. a sample of 200 voters shows that 40% support him. a. what is the population? b. what is the parameter of interest? state its value c. what is the statistics of the interest? state its value d. compare your answers in (b) and (c) is it surprising they are different? if the politician were to sample another 200 voters, which of the two numbers would most likely change? explain
Answers: 2
You know the right answer?
Questions

Mathematics, 23.11.2019 10:31
Biology, 23.11.2019 10:31

Social Studies, 23.11.2019 10:31


Mathematics, 23.11.2019 10:31

Business, 23.11.2019 10:31


History, 23.11.2019 10:31

History, 23.11.2019 10:31
Biology, 23.11.2019 10:31

Physics, 23.11.2019 10:31
Physics, 23.11.2019 10:31
Spanish, 23.11.2019 10:31
History, 23.11.2019 10:31


