The graph shows a company's profits over a two-year
period.
Drag each section into the box t...

Mathematics, 09.02.2021 21:20 joselaboyNC16
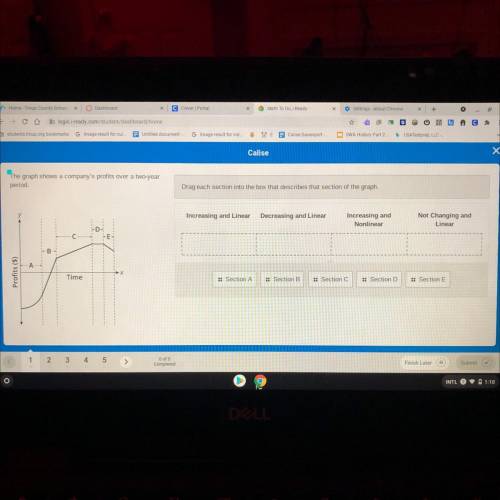
The graph shows a company's profits over a two-year
period.
Drag each section into the box that describes that section of the graph.
Increasing and Linear Decreasing and Linear
Increasing and
Nonlinear
Not Changing and
Linear
-D
B
Profits (5)
Time
Section A
:: Section B
:: Section
! Section D
.: Section E

Answers: 1


Another question on Mathematics
Mathematics, 21.06.2019 15:30
Find the slope of the line below . enter your answer as a fraction or decimal. use a slash mark ( / ) as the fraction bar if necessary
Answers: 1
Mathematics, 21.06.2019 15:50
If the dimensions of a rectangular prism are 5 ft x 3.5 ft x 2 ſt, what is the surface area?
Answers: 1
Mathematics, 21.06.2019 16:10
To find the extreme values of a function f(x.y) on a curve x-x(t), y y(t), treat f as a function of the single variable t and use the chain rule to find where df/dt is zero. in any other single-variable case, the extreme values of f are then found among the values at the critical points (points where df/dt is zero or fails to exist), and endpoints of the parameter domain. find the absolute maximum and minimum values of the following function on the given curves. use the parametric equations x=2cos t, y 2 sin t functions: curves: i) the semicircle x4,y20 i) the quarter circle x2+y-4, x20, y20 b, g(x,y)=xy
Answers: 2
You know the right answer?
Questions

Spanish, 05.07.2020 06:01
Mathematics, 05.07.2020 06:01

Mathematics, 05.07.2020 06:01
Mathematics, 05.07.2020 06:01

Chemistry, 05.07.2020 06:01
Mathematics, 05.07.2020 06:01


English, 05.07.2020 06:01

Mathematics, 05.07.2020 06:01


