
Mathematics, 09.02.2021 21:20 britt0412
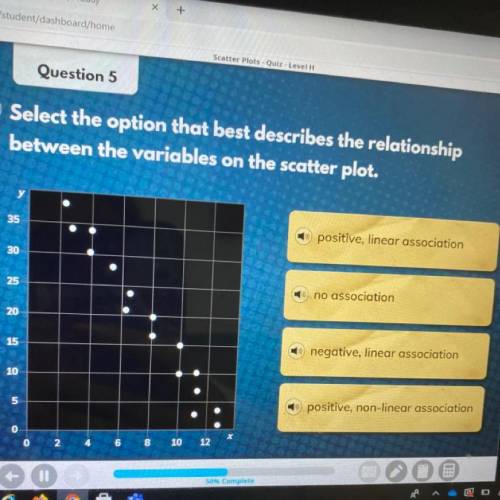
Select the option that best describes the relationship
between the variables on the scatter plot.
35
positive, linear association
30
25
no association
20
15
negative, linear association
10
5
positive, non-linear association
0

Answers: 3


Another question on Mathematics
Mathematics, 21.06.2019 17:00
Which set of reflections would carry trapezoid abcd onto itself? a) x-axis, y=x, y-axis, x-axis b) x-axis, y-axis, x-axis c) y=x, x-axis, x-axis d) y-axis, x-axis, y-axis, x-axis
Answers: 2
Mathematics, 21.06.2019 21:30
Data from 2005 for various age groups show that for each $100 increase in the median weekly income for whites, the median weekly income of blacks increases by $105. also, for workers of ages 25 to 54 the median weekly income for whites was $676 and for blacks was $527. (a) let w represent the median weekly income for whites and b the median weekly income for blacks, and write the equation of the line that gives b as a linear function of w. b = (b) when the median weekly income for whites is $760, what does the equation in (a) predict for the median weekly income for blacks?
Answers: 2
Mathematics, 22.06.2019 00:30
Which graph of a hyperbola represents the equation 16x^2-y^2=16
Answers: 1
Mathematics, 22.06.2019 00:50
Problem 2. find the exact value of the remaining trigonometric functions. sketch theangle 8 for each problem. (3 points each)(a) tan 0 =o is in quadrant 2
Answers: 2
You know the right answer?
Select the option that best describes the relationship
between the variables on the scatter plot.
Questions

Physics, 29.10.2019 06:31

English, 29.10.2019 06:31
Mathematics, 29.10.2019 06:31
Mathematics, 29.10.2019 06:31


Spanish, 29.10.2019 06:31

Chemistry, 29.10.2019 06:31

Mathematics, 29.10.2019 06:31


