subject
Mathematics, 10.02.2021 22:10 trin4613

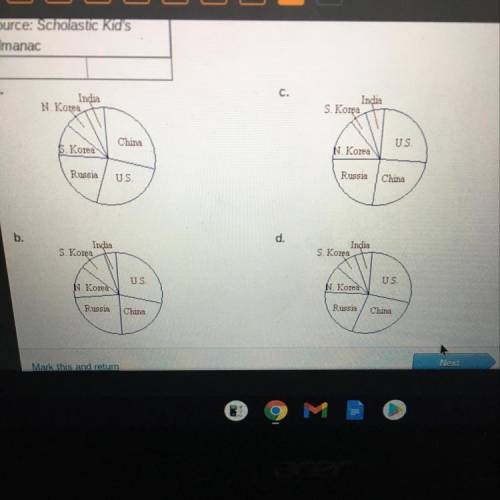
PLS HELP ITS TIMED Make a circle graph for each set of data.
Submarines

U. S.
73
China
69
Russia
56
N. Korea
26
S. Korea
19
India
16
Source: Scholastic Kid's
Almanac


PLS HELP ITS TIMED

Make a circle graph for each set of data.
Submarines
U.S.
73
China
69
Russia
5

ansver
Answers: 3

Another question on Mathematics

question
Mathematics, 21.06.2019 18:00
The given dot plot represents the average daily temperatures, in degrees fahrenheit, recorded in a town during the first 15 days of september. if the dot plot is converted to a box plot, the first quartile would be drawn at __ , and the third quartile would be drawn at __ link to graph: .
Answers: 1
question
Mathematics, 21.06.2019 18:30
You receive 15% of the profit from a car wash how much money do you receive from a profit of 300
Answers: 2
question
Mathematics, 21.06.2019 19:00
Lucy and donavan measured the length of the school garden. lucys measurement is 11.3m and donavans measurement is 113 cm. could both be correct? explain
Answers: 1
question
Mathematics, 22.06.2019 00:00
Cody ran nine miles on his first day of training. the next day he ran 1/8 that distance. how far did he run the second day?
Answers: 2
You know the right answer?
PLS HELP ITS TIMED Make a circle graph for each set of data.
Submarines

U. S.
Questions
Questions on the website: 13722361