
Mathematics, 11.02.2021 01:30 ctyrector
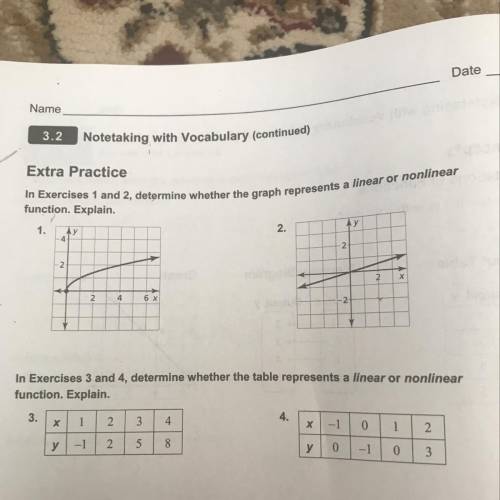
In Exercises 1 and 2, determine whether the graph represents a linear or nonlinear
function. Explain.
1.
Ay
4
2.
Ay
2.
-2
2.
2
4
6 x
-2

Answers: 3


Another question on Mathematics
Mathematics, 21.06.2019 18:30
School has 204 sixth grade students. if the sixth grade is 30% of the total school, how many students are in the middle school?
Answers: 2
Mathematics, 22.06.2019 00:30
Which number can each term of the equation be multiplied by to eliminate the decimals before solving? 5.6j- 0.12=4+1.1j
Answers: 3
Mathematics, 22.06.2019 01:10
What is the angle measure, or angle of depression, between this bird and the bird watcher?
Answers: 1
Mathematics, 22.06.2019 01:20
1. why is a frequency distribution useful? it allows researchers to see the "shape" of the data. it tells researchers how often the mean occurs in a set of data. it can visually identify the mean. it ignores outliers. 2. the is defined by its mean and standard deviation alone. normal distribution frequency distribution median distribution marginal distribution 3. approximately % of the data in a given sample falls within three standard deviations of the mean if it is normally distributed. 95 68 34 99 4. a data set is said to be if the mean of the data is greater than the median of the data. normally distributed frequency distributed right-skewed left-skewed
Answers: 2
You know the right answer?
In Exercises 1 and 2, determine whether the graph represents a linear or nonlinear
function. Explai...
Questions

Computers and Technology, 03.07.2020 18:01


Computers and Technology, 03.07.2020 18:01

Social Studies, 03.07.2020 18:01


