
Mathematics, 11.02.2021 01:30 angelbabynn05
Oi, can someone help me with this? It would be appreciated.
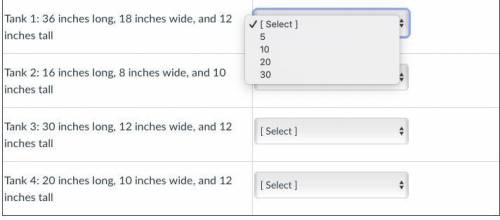
Several glass aquariums of various sizes are for sale at a pet shop. They are all shaped like rectangular prisms. A 15-gallon tank is 24 inches long, 12 inches wide, and 12 inches tall. Match the dimensions of the other tanks with the volume of water they can each hold.
(They all have the same options shown in the picture)

Answers: 1


Another question on Mathematics
Mathematics, 21.06.2019 13:40
On any given day, the number of users, u, that access a certain website can be represented by the inequality 1125-4530 which of the following represents the range of users that access the website each day? u> 95 or u < 155 95> u> 155 u< 95 or > 155 95
Answers: 2
Mathematics, 21.06.2019 16:00
Part one: measurements 1. measure your own height and arm span (from finger-tip to finger-tip) in inches. you will likely need some from a parent, guardian, or sibling to get accurate measurements. record your measurements on the "data record" document. use the "data record" to you complete part two of this project. name relationship to student x height in inches y arm span in inches archie dad 72 72 ginelle mom 65 66 sarah sister 64 65 meleah sister 66 3/4 67 rachel sister 53 1/2 53 emily auntie 66 1/2 66 hannah myself 66 1/2 69 part two: representation of data with plots 1. using graphing software of your choice, create a scatter plot of your data. predict the line of best fit, and sketch it on your graph. part three: the line of best fit include your scatter plot and the answers to the following questions in your word processing document 1. 1. which variable did you plot on the x-axis, and which variable did you plot on the y-axis? explain why you assigned the variables in that way. 2. write the equation of the line of best fit using the slope-intercept formula $y = mx + b$. show all your work, including the points used to determine the slope and how the equation was determined. 3. what does the slope of the line represent within the context of your graph? what does the y-intercept represent? 5. use the line of best fit to you to describe the data correlation.
Answers: 2
Mathematics, 21.06.2019 16:00
Ernest is purchasing a $175,000 home with a 30-year mortgage. he will make a $15,000 down payment. use the table below to find his monthly pmi payment.
Answers: 2
Mathematics, 21.06.2019 19:30
For what values of the variable x is the expression square root of 7x+14+ square root of 7-x a real number?
Answers: 1
You know the right answer?
Oi, can someone help me with this? It would be appreciated.
Several glass aquariums of various size...
Questions


English, 09.12.2019 17:31

Mathematics, 09.12.2019 17:31
Mathematics, 09.12.2019 17:31
Business, 09.12.2019 17:31

Mathematics, 09.12.2019 17:31

Biology, 09.12.2019 17:31

Chemistry, 09.12.2019 17:31
History, 09.12.2019 17:31


