
Mathematics, 11.02.2021 16:20 Mordred2143
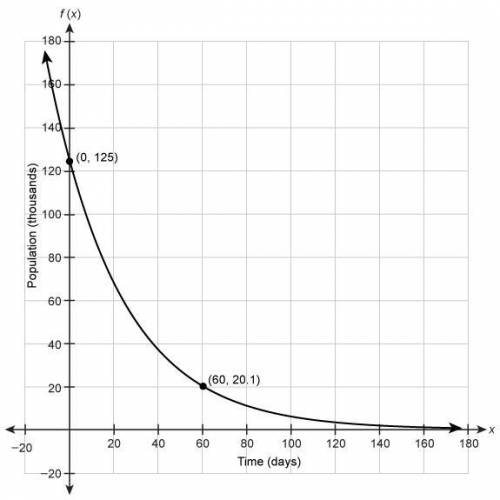
The graph models the population of a species of moth as a function of days since the count began.
What does the y-intercept represent?
The population will continue to increase.
The population when the count began was 125,000.
On day 125, there were 0 moths remaining.
The population after 60 days was 20,100.

Answers: 3


Another question on Mathematics
Mathematics, 21.06.2019 17:20
Which system of linear inequalities is represented by the graph? x-3y > 6 and y? 2x + 4 x + 3y > 6 and y? 2x - 4 x - 3y > 6 and y? 2 - 4 x + 3y > 6 and y > 2x + 4 no be 2 -1.1 1 2 3 4 5 submit save and exit next mark this and retum be
Answers: 1
Mathematics, 21.06.2019 17:30
The manufacturer of a new product developed the following expression to predict the monthly profit, in thousands of dollars, from sales of the productwhen it is sold at a unit price of x dollars.-0.5x^2 + 22x - 224what is represented by the zero(s) of the expression? a.the profit when the unit price is equal to 0b.the unit price(s) when the profit is equal to 0c.the profit when the unit price is greatestd.the unit price(s) when profit is greatest
Answers: 3
Mathematics, 21.06.2019 18:00
Arecipe calls for 32 fluid ounces of heavy cream.how many 1 pint containers of heavy cream are needed to make the recipe?
Answers: 2
Mathematics, 21.06.2019 23:00
What is the length of the midsegment of a trapezoid with bases of length 15 and 25 ?
Answers: 1
You know the right answer?
The graph models the population of a species of moth as a function of days since the count began.
W...
Questions


Business, 25.11.2021 14:00


Business, 25.11.2021 14:00

Chemistry, 25.11.2021 14:00
Chemistry, 25.11.2021 14:00
English, 25.11.2021 14:00

Mathematics, 25.11.2021 14:00
Mathematics, 25.11.2021 14:00

Social Studies, 25.11.2021 14:00
Chemistry, 25.11.2021 14:00
English, 25.11.2021 14:00
Mathematics, 25.11.2021 14:00


