2 Samuel created a scatter plot of the
relationship between the number of miles
away from sch...

Mathematics, 11.02.2021 21:40 StevencoolGG
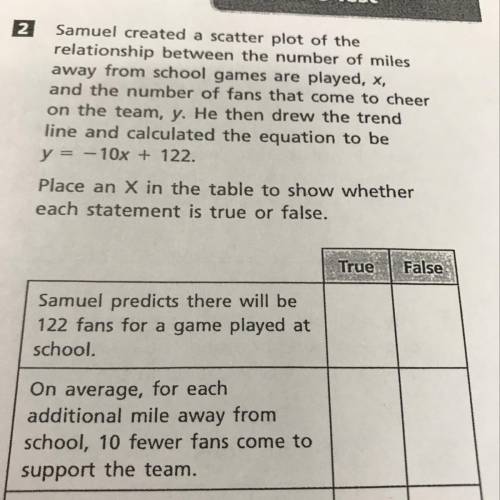
2 Samuel created a scatter plot of the
relationship between the number of miles
away from school games are played, X
and the number of fans that come to cheer
on the team. y. He then drew the trend
line and calculated the equation to be
y = -10x + 122.
Place an X in the table to show whether
each statement is true or false.
True
False
Samuel predicts there will be
122 fans for a game played at
school.
On average, for each
additional mile away from
school, 10 fewer fans come to
support the team.
An estimated 10 fans will
attend a game played 122
miles from school.

Answers: 3


Another question on Mathematics
Mathematics, 21.06.2019 12:40
What are the domain and range of the functiony = 2(x - 3)2 + 4?
Answers: 2
Mathematics, 21.06.2019 18:30
Atriangle with all sides of equal length is a/an triangle. a. right b. scalene c. equilateral d. isosceles
Answers: 2
Mathematics, 21.06.2019 22:30
Acampus club held a bake sale as a fund raiser, selling coffee, muffins, and bacon and eggs sandwiches. the club members charged $1 for a cup of coffee, 3$ for a muffin , and $4 for a back. and egg sandwich. they sold a total of 55 items , easing $119. of the club members sold 5 more muffins than cups of coffee, how many bacon and egg sandwiches he’s did they sell
Answers: 1
You know the right answer?
Questions

Mathematics, 06.05.2020 23:20

History, 06.05.2020 23:20
Mathematics, 06.05.2020 23:20


Mathematics, 06.05.2020 23:20
Mathematics, 06.05.2020 23:20
Mathematics, 06.05.2020 23:20

Mathematics, 06.05.2020 23:20
Mathematics, 06.05.2020 23:20
Mathematics, 06.05.2020 23:20


