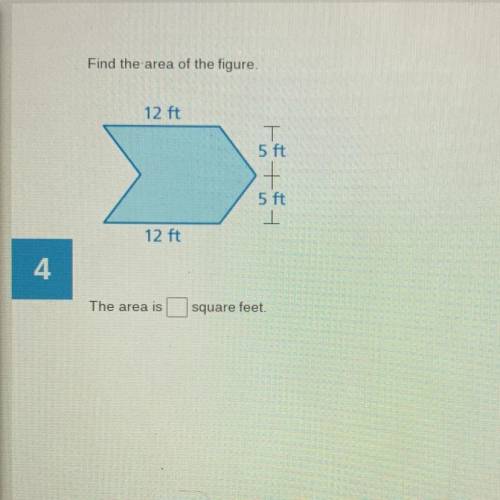
Find the area of the figure.
12 ft
5 ft
+
5 ft
12 ft
4
The area...

Mathematics, 12.02.2021 04:20 youngbeauty17
Find the area of the figure.
12 ft
5 ft
+
5 ft
12 ft
4
The area is
square feet

Answers: 2


Another question on Mathematics
Mathematics, 22.06.2019 01:00
Acentral angle measuring 160 degrees intercepts an arc in a circle whose radius is 4. what is the length of the arc the circle formed by this central angle? round the length of the arc to the nearest hundredth of a unit. a) 4.19 units b) 6.28 units c) 12.57 units d) 12.57 square units
Answers: 3
Mathematics, 22.06.2019 01:30
Apasta salad was chilled in the refrigerator at 35° f overnight for 9 hours. the temperature of the pasta dish dropped from 86° f to 38° f. what was the average rate of cooling per hour?
Answers: 3
Mathematics, 22.06.2019 02:30
Atrain traveled for 1.5 hours to the first station, stopped for 30 minutes, then traveled for 4 hours to the final station where it stopped for 1 hour. the total distance traveled is a function of time. which graph most accurately represents this scenario? a graph is shown with the x-axis labeled time (in hours) and the y-axis labeled total distance (in miles). the line begins at the origin and moves upward for 1.5 hours. the line then continues upward at a slow rate until 2 hours. from 2 to 6 hours, the line continues quickly upward. from 6 to 7 hours, it moves downward until it touches the x-axis a graph is shown with the axis labeled time (in hours) and the y axis labeled total distance (in miles). a line is shown beginning at the origin. the line moves upward until 1.5 hours, then is a horizontal line until 2 hours. the line moves quickly upward again until 6 hours, and then is horizontal until 7 hours a graph is shown with the axis labeled time (in hours) and the y-axis labeled total distance (in miles). the line begins at the y-axis where y equals 125. it is horizontal until 1.5 hours, then moves downward until 2 hours where it touches the x-axis. the line moves upward until 6 hours and then moves downward until 7 hours where it touches the x-axis a graph is shown with the axis labeled time (in hours) and the y-axis labeled total distance (in miles). the line begins at y equals 125 and is horizontal for 1.5 hours. the line moves downward until 2 hours, then back up until 5.5 hours. the line is horizontal from 5.5 to 7 hours
Answers: 1
You know the right answer?
Questions
Mathematics, 30.08.2021 14:00

Biology, 30.08.2021 14:00

English, 30.08.2021 14:00

History, 30.08.2021 14:00
English, 30.08.2021 14:00

Arts, 30.08.2021 14:00

World Languages, 30.08.2021 14:00
Mathematics, 30.08.2021 14:00

Health, 30.08.2021 14:00
English, 30.08.2021 14:00
English, 30.08.2021 14:00
English, 30.08.2021 14:00
English, 30.08.2021 14:00


