Can someone do it quickly since it’s a timed test
Paper 2
The scatter diagram shows the score...

Mathematics, 12.02.2021 14:10 spycn5069
Can someone do it quickly since it’s a timed test
Paper 2
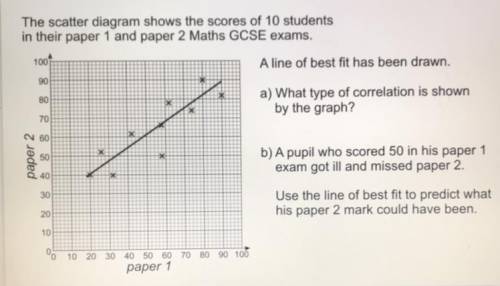
The scatter diagram shows the scores of 10 students
in their paper 1 and paper 2 Maths GCSE exams.
1001
A line of best fit has been drawn.
90
a) What type of correlation is shown
by the graph?
80
A
70
60
paper 2
50
40
b) A pupil who scored 50 in his paper 1
exam got ill and missed paper 2.
Use the line of best fit to predict what
his paper 2 mark could have been
30
20
10
10 20 30 40 50 60 70 80 90 100
paper 1

Answers: 3


Another question on Mathematics
Mathematics, 21.06.2019 16:40
The table shows the total distance that myra runs over different time periods. which describes myra’s distance as time increases? increasing decreasing zero constant
Answers: 2
Mathematics, 21.06.2019 20:00
Mat bought a phone for $100. he has to pay $30 per mouth. if he has paid $640 in total, how many mouth has he had the phone?
Answers: 2
You know the right answer?
Questions

Chemistry, 14.09.2019 07:20

Computers and Technology, 14.09.2019 07:20
Chemistry, 14.09.2019 07:20
Chemistry, 14.09.2019 07:20
Chemistry, 14.09.2019 07:20
Chemistry, 14.09.2019 07:20
Chemistry, 14.09.2019 07:20
Chemistry, 14.09.2019 07:20
Chemistry, 14.09.2019 07:20


