
Mathematics, 12.02.2021 16:50 kyleejokow
Need help with A&B
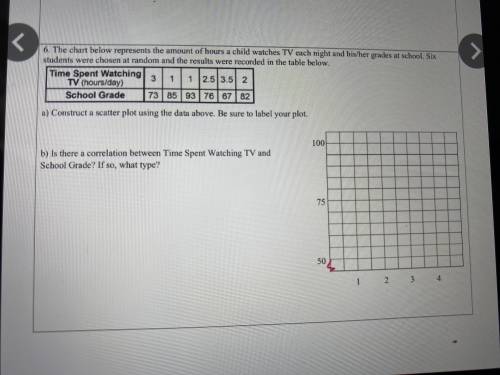
the chart below represents the amount of hours a child watches tv each night and his/her grades at schools. six students were chosen at random and the results were recorded in the table below
A) construct a scatter plot using the data above be sure to label your plot.
B) is there a correlation between time spent watching tv and school grade? if so, what type?

Answers: 1


Another question on Mathematics
Mathematics, 21.06.2019 20:30
The areas of two similar triangles are 72dm2 and 50dm2. the sum of their perimeters is 226dm. what is the perimeter of each of these triangles?
Answers: 1
Mathematics, 22.06.2019 00:20
❤️ (geometry) does the construction demonstrate how to copy an angle correctly using technology a) yes; the distance between points a and f was used to create circle h b) yes; the distance between points f and g was used to create circle h c)no; the distance between points a and f was used to create circle h d) no; the distance between points f and g was used to create circle h
Answers: 2
Mathematics, 22.06.2019 02:00
Use long division to indentify (12xto the second power+15x-8)divided by 3x
Answers: 2
You know the right answer?
Need help with A&B
the chart below represents the amount of hours a child watches tv each night...
Questions


Biology, 02.07.2019 16:10

Computers and Technology, 02.07.2019 16:10
Biology, 02.07.2019 16:10


Biology, 02.07.2019 16:10
Biology, 02.07.2019 16:10
Biology, 02.07.2019 16:10
Biology, 02.07.2019 16:10
Biology, 02.07.2019 16:10
Biology, 02.07.2019 16:10
Biology, 02.07.2019 16:10
Biology, 02.07.2019 16:10


