
Mathematics, 12.02.2021 18:50 Alexis3456829
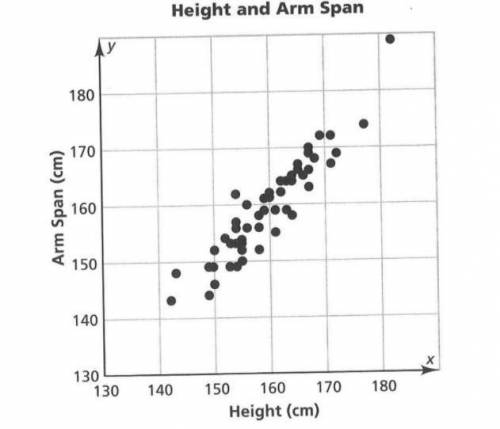
A group of 54 sixth-grade students measured their arm spans and their heights. Their data are shown in the scatter plot.
Use the scatter plot to answer the following questions.
1.) Find a trend line to model the data and add it to the scatterplot.
2.) How might you use this line to describe the relationship between height and arm span? (Describe the general relationship then discuss the correlation between the two variables and any other relationships that you notice. I’m looking for more than one sentence.)
3.) Write an equation for this line using for height and for arm span. Show work.
4.) What estimate would you give for the arm span of a sixth-grade student whose height is 165 cm? Explain your reasoning.
5.) What is true about the relationship between height and arm span for the points on the line? What is true for the points above the line? For the points below the line?

Answers: 3


Another question on Mathematics
Mathematics, 21.06.2019 16:00
Afurniture manufacturer produces chairs and sofas. each chair requires 10 yards of fabric, and each sofa requires 20 yards of fabric. the manufacturer has 300 yards of fabric available. to fulfill orders, the number of sofas must be at least twice the number of chairs. let x be the number of chairs and y the number of sofas. which inequalities are described in the problem? check all of the boxes that apply
Answers: 2
Mathematics, 21.06.2019 18:50
The number of fish in a lake can be modeled by the exponential regression equation y=14.08 x 2.08^x where x represents the year
Answers: 3
Mathematics, 21.06.2019 20:50
There are three bags: a (contains 2 white and 4 red balls), b (8 white, 4 red) and c (1 white 3 red). you select one ball at random from each bag, observe that exactly two are white, but forget which ball came from which bag. what is the probability that you selected a white ball from bag a?
Answers: 1
Mathematics, 21.06.2019 21:30
High school seniors with strong academic records apply to the nation’s most selective colleges in greater numbers each year. because the number of slots remains relatively stable, some colleges reject more early applicants. suppose that for a recent admissions class, an ivy league college received 2851 applications for early admission. of this group, it admitted 1033 students early, rejected 854 outright, and deferred 964 to the regular admission pool for further consideration. in the past, this school has admitted 18% of the deferred early admission applicants during the regular admission process. counting the students admitted early and the students admitted during the regular admission process, the total class size was 2375. let e, r, and d represent the events that a student who applies for early admission is admitted early, rejected outright, or deferred to the regular admissions pool.suppose a student applies for early admission. what is the probability that the student will be admitted for early admission or be deferred and later admitted during the regular admission process?
Answers: 3
You know the right answer?
A group of 54 sixth-grade students measured their arm spans and their heights. Their data are shown...
Questions

History, 20.10.2019 06:10

English, 20.10.2019 06:10

Social Studies, 20.10.2019 06:10
Mathematics, 20.10.2019 06:10

Chemistry, 20.10.2019 06:10
Mathematics, 20.10.2019 06:10
History, 20.10.2019 06:10
Mathematics, 20.10.2019 06:10


Mathematics, 20.10.2019 06:10
Mathematics, 20.10.2019 06:10


