
Mathematics, 12.02.2021 22:40 andrwisawesome0
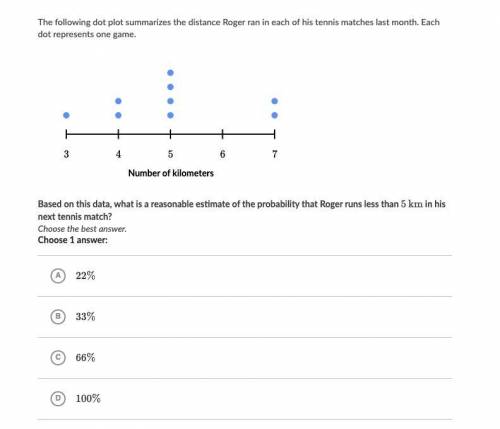
The following dot plot summarizes the distance Roger ran in each of his tennis matches last month. Each dot represents one game. Based on this data, what is a reasonable estimate of the probability that Roger runs less than 5 km in his next tennis match?

Answers: 3


Another question on Mathematics
Mathematics, 21.06.2019 21:00
These box plots show the number of electoral votes one by democratic and republican presidential candidates for the elections from 1984 through 2012. which statement best compares the spread of the data sets
Answers: 2
Mathematics, 21.06.2019 23:00
How many heads would you expect if you flipped a coin twice? first, fill in the table below with the correct probabilities. hint: the sample space for flipping a coin twice is {hh, ht, th, tt}. a = b = c = f
Answers: 1
Mathematics, 21.06.2019 23:10
Astudent draws two parabolas on graph paper. both parabolas cross the x-axis at (–4, 0) and (6, 0). the y-intercept of the first parabola is (0, –12). the y-intercept of the second parabola is (0, –24). what is the positive difference between the a values for the two functions that describe the parabolas? write your answer as a decimal rounded to the nearest tenth
Answers: 2
Mathematics, 21.06.2019 23:40
For a function f(x), a) if f(7) = 22 then f^-1(22) = b) f^-1(f(c)) =
Answers: 2
You know the right answer?
The following dot plot summarizes the distance Roger ran in each of his tennis matches last month. E...
Questions

Social Studies, 03.02.2021 17:30


Biology, 03.02.2021 17:30

English, 03.02.2021 17:30
Mathematics, 03.02.2021 17:30

History, 03.02.2021 17:30
English, 03.02.2021 17:30

Physics, 03.02.2021 17:30
English, 03.02.2021 17:30
Social Studies, 03.02.2021 17:30
Arts, 03.02.2021 17:30
Mathematics, 03.02.2021 17:30


