
Mathematics, 15.02.2021 01:00 momosoccer2545
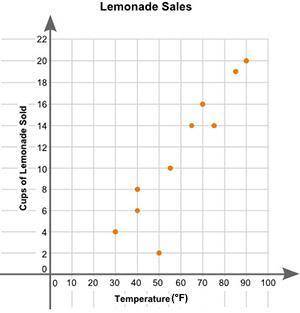
Eric plotted the graph below to show the relationship between the temperature of his city and the number of cups of lemonade he sold daily
Part A: Describe the relationship between the temperature of the city and the number of cups of lemonade sold. (2 points)
Part B: Describe how you can make the line of best fit. Write the approximate slope and y-intercept of the line of best fit. Show your work, including the points that you use to calculate the slope and y-intercept. (3 points)

Answers: 2


Another question on Mathematics
Mathematics, 20.06.2019 18:02
In two fractions have the same denominator but different numerators,which fraction is greater? give an example
Answers: 2
Mathematics, 21.06.2019 15:00
What is the value with a place of tenths in 907.456 1) 0 2) 6 3) 4 4) 5
Answers: 1
Mathematics, 21.06.2019 22:00
Serena is making an experiment. for that, she needs 20 grams of a 52% solution of salt. she has two large bottles of salt water: one with 40% and the other with 70% of salt in them. how much of each must she use to make the solution she needs? i am in need of
Answers: 1
You know the right answer?
Eric plotted the graph below to show the relationship between the temperature of his city and the nu...
Questions
Mathematics, 26.01.2020 03:31


Social Studies, 26.01.2020 03:31

Physics, 26.01.2020 03:31
Social Studies, 26.01.2020 03:31
Mathematics, 26.01.2020 03:31

English, 26.01.2020 03:31

Biology, 26.01.2020 03:31


