
Mathematics, 15.02.2021 04:40 NotYourStudent
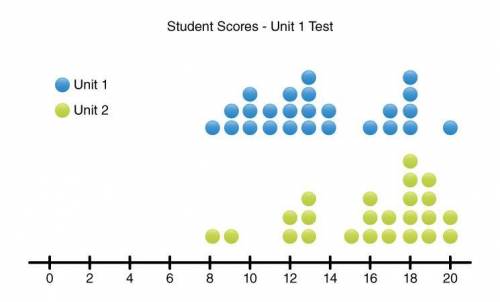
The following dot plot represents student scores on both the Unit 1 and Unit 2 math tests. Scores are in whole number increments.
Part 1: Looking at the data plots, which test do you think the students scored better on? Do you think one of the tests has more variation than the other or is the variation about the same for both tests? Use complete sentences in your answer and explain your reasoning.
Part 2: Calculate the mean (rounded to the nearest whole number) and mean absolute deviation for the Unit 1 test.
Part 3: Do your results from part B prove or disprove your hypotheses from part A? Use complete sentences in your answer and explain your reasoning

Answers: 2


Another question on Mathematics
Mathematics, 21.06.2019 20:40
Michelle is planting flowers in her garden. she wants the ratio of daises to carnations to be 3 to 2. michelle wants to plant a total of 35 flowers. how many daises should she plant?
Answers: 3
Mathematics, 22.06.2019 02:00
Two sides of a right triangle measure 2 units and 4 units. what is the area of the square that shares a side with the third side of the triangle?
Answers: 2
Mathematics, 22.06.2019 06:00
Graph a sine function whose amplitude is 3, period is 4π , midline is y = 2, and y-intercept is (0, 2) . the graph is not a reflection of the parent function over the x-axis. use the sine tool to graph the function. the first point must be on the midline and the second point must be a maximum or minimum value on the graph closest to the first point.
Answers: 1
You know the right answer?
The following dot plot represents student scores on both the Unit 1 and Unit 2 math tests. Scores ar...
Questions

History, 11.01.2020 09:31
History, 11.01.2020 09:31


Mathematics, 11.01.2020 09:31

Health, 11.01.2020 09:31

Mathematics, 11.01.2020 09:31

Mathematics, 11.01.2020 09:31


