
Mathematics, 16.02.2021 01:40 atifgujar
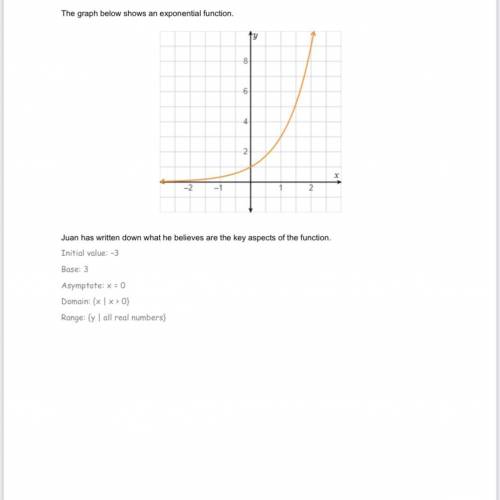
follow this link to view juan’s work. critique juan’s work by justifying correct solutions and by explaining any errors he made. for any errors made, provide and explain a correct response. be sure to explain each key aspect of the graph.

Answers: 1


Another question on Mathematics
Mathematics, 21.06.2019 14:30
In the image, point a marks the center of the circle. which two lengths must form a ratio of 1 : 2? (options are in the images since thought they were harmful phrases)
Answers: 1
Mathematics, 21.06.2019 16:00
Part one: measurements 1. measure your own height and arm span (from finger-tip to finger-tip) in inches. you will likely need some from a parent, guardian, or sibling to get accurate measurements. record your measurements on the "data record" document. use the "data record" to you complete part two of this project. name relationship to student x height in inches y arm span in inches archie dad 72 72 ginelle mom 65 66 sarah sister 64 65 meleah sister 66 3/4 67 rachel sister 53 1/2 53 emily auntie 66 1/2 66 hannah myself 66 1/2 69 part two: representation of data with plots 1. using graphing software of your choice, create a scatter plot of your data. predict the line of best fit, and sketch it on your graph. part three: the line of best fit include your scatter plot and the answers to the following questions in your word processing document 1. 1. which variable did you plot on the x-axis, and which variable did you plot on the y-axis? explain why you assigned the variables in that way. 2. write the equation of the line of best fit using the slope-intercept formula $y = mx + b$. show all your work, including the points used to determine the slope and how the equation was determined. 3. what does the slope of the line represent within the context of your graph? what does the y-intercept represent? 5. use the line of best fit to you to describe the data correlation.
Answers: 2
Mathematics, 21.06.2019 19:40
The krasnapolski is a top-of-the-line hotel in amsterdam, the netherlands. among their many services, they rent bicycles to guests. the bicycle checkout is open 24 hours per day 7 days per week and has 50 bicycles on hand. on average, 10 guests request a bicycle each day, arriving completely randomly at all times of the day during the spring and summer seasons. guests keep bicycles for four days on average, with a standard deviation of two days. how long does a guest on average have to wait for a bike? a. approximately 24 hours b. approximately 0.033 hours c. approximately 4 days d. approximately 47 minutes
Answers: 3
Mathematics, 21.06.2019 22:00
What is the equation of the line that is parallel to the line with the equation y= -3/4x +1 and passes through the point (12,-12)
Answers: 1
You know the right answer?
follow this link to view juan’s work. critique juan’s work by justifying correct solutions and by ex...
Questions


History, 20.11.2021 08:40
Mathematics, 20.11.2021 08:40

Computers and Technology, 20.11.2021 08:40
Mathematics, 20.11.2021 08:40
Physics, 20.11.2021 08:40


English, 20.11.2021 08:40
Mathematics, 20.11.2021 08:40
Mathematics, 20.11.2021 08:40
Mathematics, 20.11.2021 08:40
Mathematics, 20.11.2021 08:40


