
Mathematics, 16.02.2021 02:40 Machuco127
I need help with questions A&B please answer!!
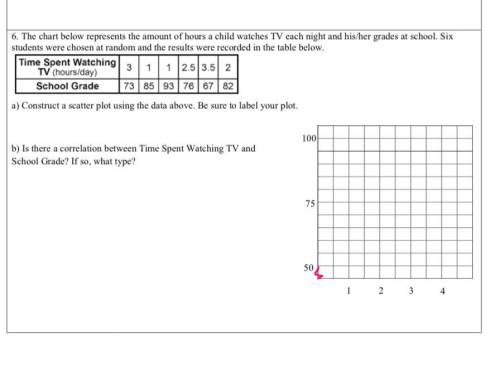
The chart below represents the amount of hours a child watches TV each night and his/her grades at school. Six students were chosen at random and the results were recorded in the table below.
a) Construct a scatter plot using the data above. Be sure to label your plot.
b) Is there a correlation between Time Spent Watching TV and School Grade? If so, what type?

Answers: 1


Another question on Mathematics
Mathematics, 21.06.2019 15:20
(a) (8%) compute the probability of an even integer among the 100 integers 1! , 2! , 3! , until 100! (here n! is n factorial or n*(n-1)*(n-2) *… 1) (b) (16%) compute the probability of an even integer among the 100 integers: 1, 1+2, 1+2+3, 1+2+3+4, …., 1+2+3+… + 99, and 1+2+3+… + 100
Answers: 1
Mathematics, 21.06.2019 18:00
Which statement about the relative areas of δabc and δxyz is true? the area of δabc > the area of δxyz the area of δabc < the area of δxyz the area of δabc = the area of δxyz more information is needed to compare.
Answers: 2
Mathematics, 22.06.2019 00:30
The high temp today was 62°. when nighttime comes, the temp will drop 40°. by 4am the temp will drop an additional 40°. what is the temp at 4am?
Answers: 2
Mathematics, 22.06.2019 01:30
Jon’s weight loss for each week of the month is 5 lbs., 2.5 lbs., and 2.5 lbs. he gained 3.5 lbs. the last week. if jon originally weighed 198 lbs., how much does he weigh now?
Answers: 1
You know the right answer?
I need help with questions A&B please answer!!
The chart below represents the amount of hours a...
Questions

Social Studies, 24.10.2020 09:30

English, 24.10.2020 09:30

Biology, 24.10.2020 09:30
Mathematics, 24.10.2020 09:30
English, 24.10.2020 09:30
Mathematics, 24.10.2020 09:30

Health, 24.10.2020 09:30

Business, 24.10.2020 09:30
English, 24.10.2020 09:30

Arts, 24.10.2020 09:30

Chemistry, 24.10.2020 09:30

History, 24.10.2020 09:30
Chemistry, 24.10.2020 09:30


