
Mathematics, 16.02.2021 09:00 awkwardkid0123
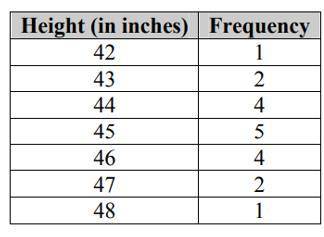
Mr Storer, the physical education teacher, measured the height of each student in his firsts period class. He organized his data in this chart below.
a. Make a dot plot for the data.
b. Make a histogram for the data.
c. Make a box plot for the data.
d. Does the distribution of heights appear normal/ bell-shaped?

Answers: 3


Another question on Mathematics
Mathematics, 21.06.2019 19:00
1c) the number 131 is a term in the sequence defined by the explicit rule f(n)=5n-4. which term in the sequence is 131? 2a) write the first four terms of the function f(n)=n^2-1 2b) what is the 10th term of the sequence defined by the explicit rule f(n)=n^2-1 2c) the number 224 is a term in the sequence defined by the explicit rule f(n)=n^2-1. which term in the sequence is 224?
Answers: 2
Mathematics, 21.06.2019 21:30
Look at triangle wxy what is the length (in centimeters) of the side wy of the triangle?
Answers: 2
Mathematics, 21.06.2019 23:30
Maddie's rectangular kitchen has an area of 10 square yards and a length of 3 3/4 yards.how many yards wide is maddie's kitchen?
Answers: 1
You know the right answer?
Mr Storer, the physical education teacher, measured the height of each student in his firsts period...
Questions


English, 17.10.2021 14:00
Mathematics, 17.10.2021 14:00
Mathematics, 17.10.2021 14:00

English, 17.10.2021 14:00
Mathematics, 17.10.2021 14:00

Biology, 17.10.2021 14:00
Mathematics, 17.10.2021 14:00

Computers and Technology, 17.10.2021 14:00

Physics, 17.10.2021 14:00
Mathematics, 17.10.2021 14:00


