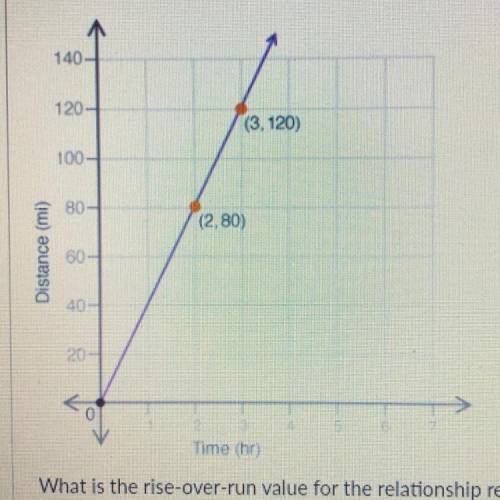
The graph shows the distance a car traveled, y, in x hours:
140
120-
(3.120)
100-...

Mathematics, 16.02.2021 16:50 stephanieanaya7
The graph shows the distance a car traveled, y, in x hours:
140
120-
(3.120)
100-
80-
(2.80)
Distance (mi)
60-
40-
20
Time thr)
What is the rise-over-run value for the relationship represented in the graph? (4 points)
40
80
o
1
40
80

Answers: 3


Another question on Mathematics
Mathematics, 21.06.2019 17:00
Jose bought 20 shares of netflix at the close price of $117.98. in a few years, jose sells all of his shares at $128.34. how much money did jose make? a.) $192.50 b.) $207.20 c.) $212.50 d.) $224.60
Answers: 1
Mathematics, 21.06.2019 19:30
Acollection of coins has value of 64 cents. there are two more nickels than dimes and three times as many pennies as dimes in this collection. how many of each kind of coin are in the collection?
Answers: 1
Mathematics, 21.06.2019 20:00
An investment decreases in value by 30% in the first year and decreases by 40% in the second year. what is the percent decrease in percentage in the investment after two years
Answers: 1
Mathematics, 21.06.2019 20:00
15 there is a line that includes the point 0,10 and has a slope of 7/4. what is it’s equation in slope intercept form
Answers: 1
You know the right answer?
Questions

Mathematics, 21.05.2021 20:50

Mathematics, 21.05.2021 20:50
Mathematics, 21.05.2021 20:50

Geography, 21.05.2021 20:50


Chemistry, 21.05.2021 20:50

History, 21.05.2021 20:50

Mathematics, 21.05.2021 20:50
Social Studies, 21.05.2021 20:50
Physics, 21.05.2021 20:50
Chemistry, 21.05.2021 20:50
Mathematics, 21.05.2021 20:50


