Mathematics, 16.02.2021 21:10 babygirl6571
(05.02 LC)
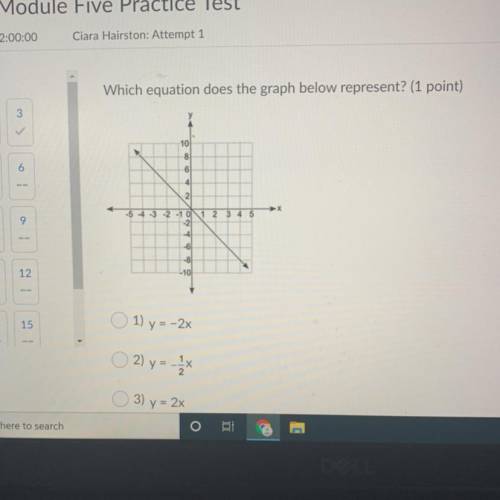
Which equation does the graph below represent?
10
8
6
NA
-5 -4 -3 -2 -1 0 1 2 3 4 5
-21
-4
-6
-8
-10


Answers: 1


Another question on Mathematics

Mathematics, 21.06.2019 18:00
Jose predicted that he would sell 48 umbrellas. he actually sold 72 umbrellas. what are the values of a and b in the table below? round to the nearest tenth if necessary
Answers: 2


Mathematics, 21.06.2019 21:00
What is the value of m in the equation 1/2 m - 3/4n=16 when n=8
Answers: 1

Mathematics, 21.06.2019 22:20
(b) suppose that consolidated power decides to use a level of significance of α = .05, and suppose a random sample of 100 temperature readings is obtained. if the sample mean of the 100 temperature readings is x⎯⎯ = 60.990, test h0 versus ha and determine whether the power plant should be shut down and the cooling system repaired. perform the hypothesis test by using a critical value and a p-value. assume σ = 5. (round your z to 2 decimal places and p-value to 4 decimal places.)
Answers: 2
You know the right answer?
(05.02 LC)
Which equation does the graph below represent?
10
8
6
NA
-...
10
8
6
NA
-...
Questions

Mathematics, 09.12.2020 05:40


Mathematics, 09.12.2020 05:40

Advanced Placement (AP), 09.12.2020 05:40

English, 09.12.2020 05:40

Advanced Placement (AP), 09.12.2020 05:40

Spanish, 09.12.2020 05:40

French, 09.12.2020 05:40

Mathematics, 09.12.2020 05:40

Chemistry, 09.12.2020 05:40


Mathematics, 09.12.2020 05:40

History, 09.12.2020 05:40

Biology, 09.12.2020 05:40


Spanish, 09.12.2020 05:40


