
Mathematics, 16.02.2021 23:40 evazquez
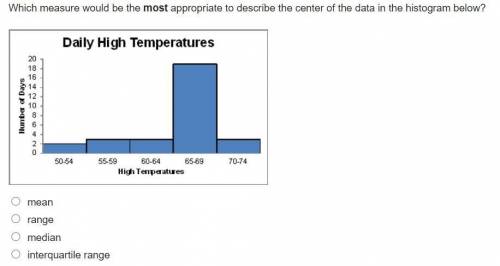
Which measure would be the most appropriate to describe the center of the data in the histogram below?
A bar graph entitled Daily High Temperatures has high temperatures on the x-axis and number of days on the y-axis, from 0 to 20. Temperatures were between 50 and 54 on 2 days; between 55 to 59 on 3 days; between 60 and 64 on 3 days; between 65 to 69 on 18 days; between 70 to 74 on 3 days.
mean
range
median
interquartile range

Answers: 3


Another question on Mathematics
Mathematics, 21.06.2019 12:30
Element x decays radioactively with a half life of 8 minutes. if there are 450 grams of element x, how long, to the nearest tenth of a minute, would it take the element to decay to 37 grams?
Answers: 2
Mathematics, 21.06.2019 18:10
If a || b and b | y, then ? a) x || y. b) x | a. c) a | y. d) a || y.
Answers: 1
Mathematics, 21.06.2019 23:00
Aremote-controlled boat can travel at 4 feet per second in calm water. the boat traveled 48 feet with the current, and then it traveled 16 feet against the current in the same amount of time. how fast is the current?
Answers: 1
Mathematics, 22.06.2019 00:50
How does the graph of y = 3x compare to the graph of y = 3-x?
Answers: 1
You know the right answer?
Which measure would be the most appropriate to describe the center of the data in the histogram belo...
Questions
Mathematics, 23.10.2020 04:01
Mathematics, 23.10.2020 04:01


Biology, 23.10.2020 04:01

Mathematics, 23.10.2020 04:01
Mathematics, 23.10.2020 04:01
Mathematics, 23.10.2020 04:01

Mathematics, 23.10.2020 04:01

Social Studies, 23.10.2020 04:01
Mathematics, 23.10.2020 04:01


