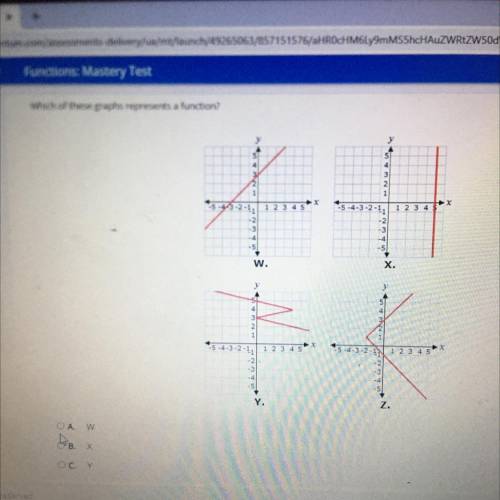
Which of these graphs represents a function?
-5-4-3-2-1, 1 2 3 4 5
-5-4-3-2-11
-5
...

Mathematics, 17.02.2021 05:50 anoynomouskali9297
Which of these graphs represents a function?
-5-4-3-2-1, 1 2 3 4 5
-5-4-3-2-11
-5
-5
w.
X.
.4-3-2-1,
1 2 3
5-4-3-2-13
1 2 3 4 5
.51
Y.

Answers: 3


Another question on Mathematics
Mathematics, 21.06.2019 13:30
What value is equivalent to 5 + [5 × (4 + 2)]? a) 35 b) 45 c) 60 d) 110
Answers: 2
Mathematics, 21.06.2019 18:30
Idon’t understand! use slope intercept form to solve: through: (2,5) slope= undefined
Answers: 1
Mathematics, 21.06.2019 18:40
What value of x is in the solution set of 4x – 12 s 16 + 8x?
Answers: 3
Mathematics, 21.06.2019 20:00
You are shooting hoops after school and make 152 out of a total of 200. what percent of shots did you make? what percent did you miss? show proportion(s).
Answers: 1
You know the right answer?
Questions

Chemistry, 29.09.2021 16:10


Mathematics, 29.09.2021 16:10
Mathematics, 29.09.2021 16:10

Biology, 29.09.2021 16:10
Mathematics, 29.09.2021 16:10
Mathematics, 29.09.2021 16:10
Chemistry, 29.09.2021 16:10


