The graph below shows the solution to which system of inequalities?
A. x< 1 and y: x
B. y&...

Mathematics, 18.02.2021 18:30 kingkushkaz2093
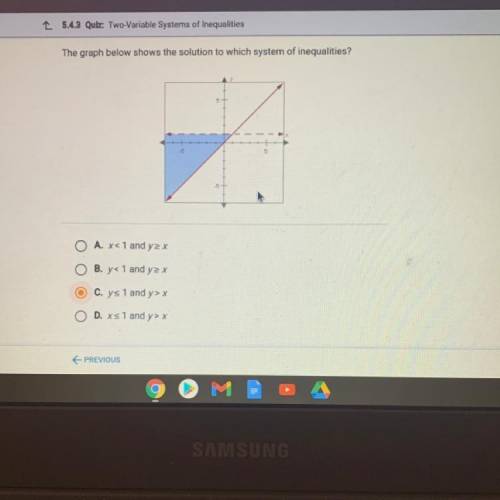
The graph below shows the solution to which system of inequalities?
A. x< 1 and y: x
B. y< 1 and y2 x
C. ys 1 and y> x
D. x< 1 and y> x

Answers: 2


Another question on Mathematics
Mathematics, 21.06.2019 18:30
Nick has box brads. he uses 4 brads for the first project. nick let’s b represent the original number of brads and finds that for the second project, the number of brads he uses is 8 more than half the difference of b and 4. write an expression to represent the number of brads he uses for the second project.
Answers: 3
Mathematics, 21.06.2019 20:20
How do the number line graphs of the solutions sets of -23 > x and x-23 differ?
Answers: 1
Mathematics, 21.06.2019 21:10
Lines b and c are parallel. what is the measure of 2? m2 = 31° m2 = 50° m2 = 120° m2 = 130°
Answers: 2
Mathematics, 21.06.2019 23:40
For a science project, a high school research team conducted a survey of local air temperatures. based on the results of the survey, the found that the average temperatures were around 10 degrees higher than expected. this result was wrong. the trouble with the survey was that most of the locations were exposed to direct sunlight and located over asphalt or sand, which resulted in higher temperatures than normal. this is a classic example of an error in which phase of inferential statistics?
Answers: 1
You know the right answer?
Questions


Mathematics, 08.02.2022 14:40
Mathematics, 08.02.2022 14:40


History, 08.02.2022 14:40

Biology, 08.02.2022 14:40

English, 08.02.2022 14:40

Mathematics, 08.02.2022 14:40

Chemistry, 08.02.2022 14:50
History, 08.02.2022 14:50
Social Studies, 08.02.2022 14:50


