
Mathematics, 18.02.2021 22:30 divaughn1906
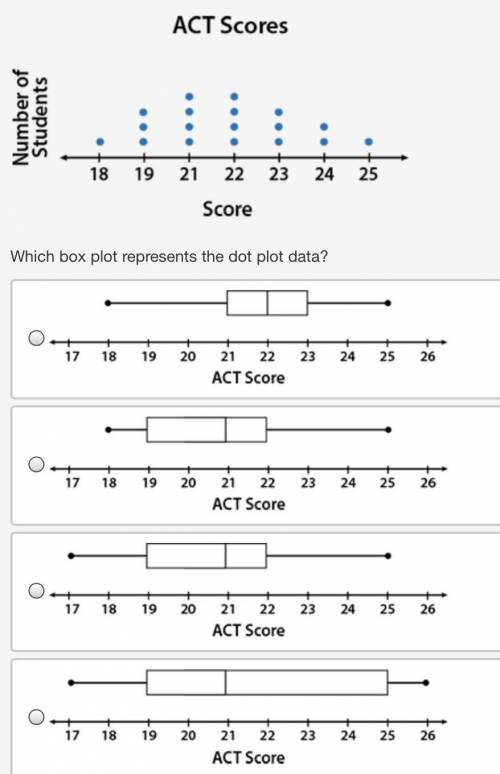
The dot plot represents a sampling of ACT scores:
dot plot titled ACT Scores with Score on the x axis and Number of Students on the y axis with 1 dot over 18, 3 dots over 19, 4 dots over 21, 4 dots over 22, 3 dots over 23, 2 dots over 24, 1 dot over 25
Which box plot represents the dot plot data?
I have pictured the possible answers.

Answers: 2


Another question on Mathematics
Mathematics, 22.06.2019 02:00
V=x^4-y^4 pick three expressions that can represent the three dimensions of the prism (each in meters)
Answers: 2
You know the right answer?
The dot plot represents a sampling of ACT scores:
dot plot titled ACT Scores with Score on the x ax...
Questions


Mathematics, 25.08.2020 22:01
Mathematics, 25.08.2020 22:01


Social Studies, 25.08.2020 22:01

Spanish, 25.08.2020 22:01


