
Mathematics, 18.02.2021 23:30 Funkyatayo
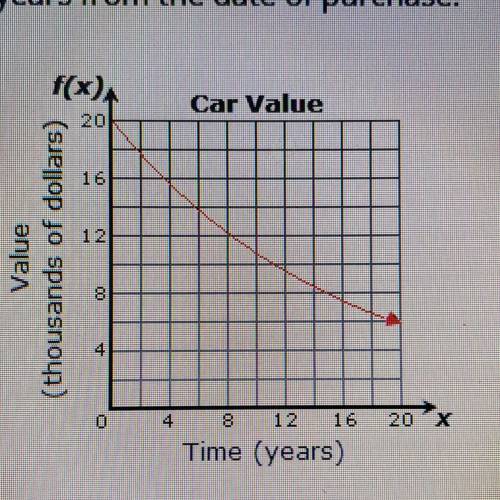
The graph represents the value of a car after years from the date of purchase.
Estimate the average rate of change over the interval [2, 8].
A. -$1,500 per year
В. -$500 per year
C. -$2,000 per year
D. -$1,000 per year

Answers: 1


Another question on Mathematics
Mathematics, 21.06.2019 13:00
The graph shows the prices of different numbers of bushels of corn at a store in the current year. the table shows the prices of different numbers of bushels of corn at the same store in the previous year. previous year number of bushels price of corn (dollars) 2 10 4 20 6 30 8 40 part a: describe in words how you can find the rate of change of a bushel of corn in the current year, and find the value. part b: how many dollars more is the price of a bushel of corn in the current year than the price of a bushel of corn in the previous year? show your work.
Answers: 1
Mathematics, 21.06.2019 13:30
1. the following set of data represents the number of waiting times in minutes from a random sample of 30 customers waiting for service at a department store. 4 5 7 10 11 11 12 12 13 15 15 17 17 17 17 17 18 20 20 21 22 22 23 24 25 27 27 31 31 32 a. determine the number of classes and class interval.
Answers: 3
Mathematics, 22.06.2019 00:10
Examine the paragraph proof. which theorem does it offer proof for? prove jnm – nmi according to the given information in the image. jk | hi while jnm and lnk are vertical angles. jnm and lnk are congruent by the vertical angles theorem. because lnk and nmi are corresponding angles, they are congruent according to the corresponding angles theorem. finally, jnm is congruent to nmi by the transitive property of equality alternate interior angles theorem gorresponding angle theorem vertical angle theorem o same side interior angles theorem
Answers: 2
You know the right answer?
The graph represents the value of a car after years from the date of purchase.
Estimate the average...
Questions
Mathematics, 18.03.2021 02:30

Social Studies, 18.03.2021 02:30

Mathematics, 18.03.2021 02:30

Mathematics, 18.03.2021 02:30

English, 18.03.2021 02:30
English, 18.03.2021 02:30
Mathematics, 18.03.2021 02:30
Physics, 18.03.2021 02:30
Biology, 18.03.2021 02:30
Biology, 18.03.2021 02:30

Mathematics, 18.03.2021 02:30
Mathematics, 18.03.2021 02:30


