Which inequality is represented by this graph?
A. -34.5 >х
B. -34.5< x
C. -35.5 >...

Mathematics, 19.02.2021 01:00 ennasawesome
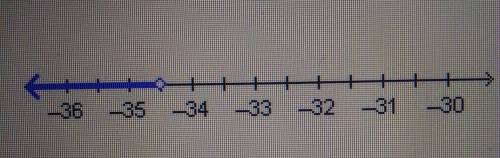
Which inequality is represented by this graph?
A. -34.5 >х
B. -34.5< x
C. -35.5 > x
D. –35.5 < x

Answers: 2


Another question on Mathematics
Mathematics, 21.06.2019 19:00
Use the formulas a = x 2 – y 2, b = 2xy, c = x 2 + y 2 to answer this question. one leg of a right triangle has length 11 and all sides are whole numbers. find the lengths of the other two sides. the other leg = a0 and the hypotenuse = a1
Answers: 2
Mathematics, 21.06.2019 20:50
What is the greatest number of parts of a circle that can be formed by cutting the circle with 7 straight cuts? (note: the parts do not have to be equal in size)
Answers: 3
Mathematics, 21.06.2019 21:00
Bo is buying a board game that usually costs bb dollars. the game is on sale, and the price has been reduced by 18\%18%. what could you find the answer?
Answers: 1
Mathematics, 21.06.2019 22:00
How many solutions does the nonlinear system of equations graphed below have? a. one b. zero c. four d. two
Answers: 2
You know the right answer?
Questions


History, 16.04.2020 00:42
History, 16.04.2020 00:42

Law, 16.04.2020 00:42

Mathematics, 16.04.2020 00:42

Biology, 16.04.2020 00:43
Mathematics, 16.04.2020 00:43


