Mathematics, 19.02.2021 18:00 koreanrice101
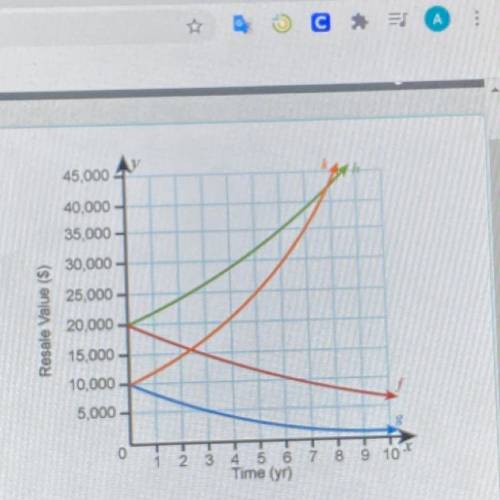
The resale value of a certain car when purchased new is $20,000. The car is expected to lose 10% of its value each year.
Which graph shows the predicted value of the car over time?
HELP I’M GIVING 18 points ASAP
The graph that shows the predicted value of the car over time is the
a. Red graph, 1
b. Blue graph, g
c. Green graph, h
d. Orange graph, k
This makes sense because it’s y-intercept is at
a. 10,000
b. 20,000
And it
a. Increases
b. Decreases


Answers: 3


Another question on Mathematics

Mathematics, 20.06.2019 18:04
Multiply. −2x(6x4−7x2+x−5) express the answer in standard form. enter your answer in the box.
Answers: 2

Mathematics, 21.06.2019 14:30
Which functions are even? check all of the boxes that apply. f(x) = x4 – x? f(x) = x2 – 3x + 2 f(x) = (x - 2) f(x) = x done
Answers: 3

Mathematics, 21.06.2019 19:00
Lucy is a dress maker. she sews \dfrac47 7 4 of a dress in \dfrac34 4 3 hour. lucy sews at a constant rate. at this rate, how many dresses does lucy sew in one hour? include fractions of dresses if applicable
Answers: 3

You know the right answer?
The resale value of a certain car when purchased new is $20,000. The car is expected to lose 10% of...
Questions

Mathematics, 20.08.2019 05:30

History, 20.08.2019 05:30

Mathematics, 20.08.2019 05:30

Social Studies, 20.08.2019 05:30


History, 20.08.2019 05:30

Mathematics, 20.08.2019 05:30


Mathematics, 20.08.2019 05:30

Biology, 20.08.2019 05:30


Mathematics, 20.08.2019 05:30

English, 20.08.2019 05:30

History, 20.08.2019 05:30


Mathematics, 20.08.2019 05:40

Biology, 20.08.2019 05:40

Social Studies, 20.08.2019 05:40


