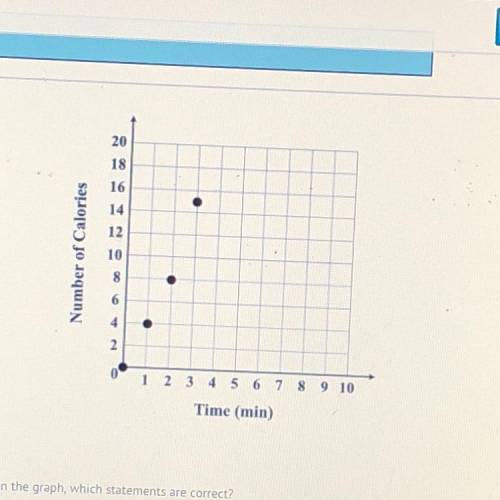
Using the data shown on the graph, which statements are correct?
A)
The constant ratio of 4 i...

Mathematics, 19.02.2021 19:20 anna8352
Using the data shown on the graph, which statements are correct?
A)
The constant ratio of 4 is
B)
The ratio of calories burned
is not consistent
time
The graph does not represent a proportional relationship,
D)
The graph represents a proportional relationship because(0, 0) is included.
E)
The graph represents a proportional relationship because x-values and y
values are constantly increasing

Answers: 2


Another question on Mathematics
Mathematics, 22.06.2019 06:00
The tax rate on harriet walker's 80,000 vacation home is 20 mills. the property is assessed at full value. how much will harriet walker's pay in taxes this year
Answers: 1
Mathematics, 22.06.2019 06:30
If a piece of wood with a length of five feet is cut into six equal pieces, what is the length of each piece?
Answers: 1
You know the right answer?
Questions
Mathematics, 16.10.2020 18:01

History, 16.10.2020 18:01

Biology, 16.10.2020 18:01

Mathematics, 16.10.2020 18:01

Advanced Placement (AP), 16.10.2020 18:01
History, 16.10.2020 18:01
Mathematics, 16.10.2020 18:01
Mathematics, 16.10.2020 18:01
Mathematics, 16.10.2020 18:01
English, 16.10.2020 18:01

Social Studies, 16.10.2020 18:01

Physics, 16.10.2020 18:01
Mathematics, 16.10.2020 18:01


