
Mathematics, 19.02.2021 23:10 CassidgTab
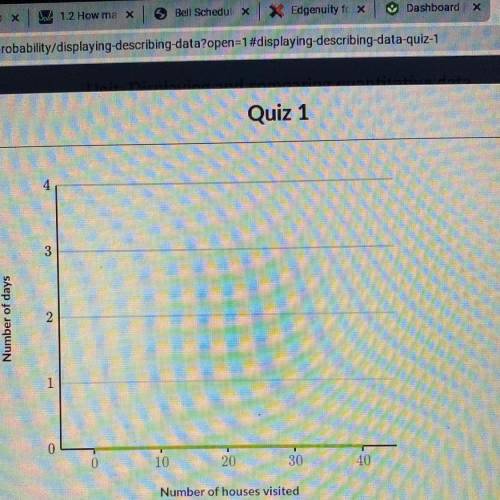
The following data points represent how many houses Greg the garbageman visited each day last week. Data points:12, 28, 33, 37, 23, 14, 9. Using the data, create a histogram.

Answers: 3


Another question on Mathematics
Mathematics, 21.06.2019 17:20
Acredit card advertises an annual interest rate of 23%. what is the equivalent monthly interest rate?
Answers: 1
Mathematics, 21.06.2019 19:00
Ab based on the given diagram, if m_1 = 60° then m 2 = 30 60 90 180
Answers: 1
Mathematics, 21.06.2019 20:30
2. explain in words how you plot the point (4, −2) in a rectangular coordinate system.
Answers: 1
Mathematics, 21.06.2019 21:30
Use the method of cylindrical shells to find the volume v generated by rotating the region bounded by the curves about the given axis.y = 7ex, y = 7e^-x, x = 1; about the y-axis
Answers: 2
You know the right answer?
The following data points represent how many houses Greg the garbageman visited each day last week....
Questions

Chemistry, 05.02.2020 05:43


History, 05.02.2020 05:44
Mathematics, 05.02.2020 05:44
Mathematics, 05.02.2020 05:44
History, 05.02.2020 05:44

Computers and Technology, 05.02.2020 05:44

Mathematics, 05.02.2020 05:44


