
Mathematics, 20.02.2021 22:50 danielanderson12
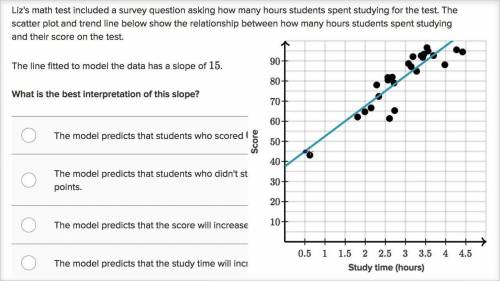
Liz's math test included a survey question asking how many hours students spent studying for the test. The scatter plot below shows the relationship between how many hours students spent studying and their score on the test. A line was fit to the data to model the relationship.

Answers: 2


Another question on Mathematics
Mathematics, 21.06.2019 21:00
Simplify. 4+3/7x-2-2/7x a. 2-5/7x b. 6-1/7x c. 2+1/7x d. 6+5/7x
Answers: 1
Mathematics, 21.06.2019 22:00
If i had 1234 apples and 1 banana what is the total amount
Answers: 2
Mathematics, 22.06.2019 06:50
Surface area of a right cone below with a radius of 3 and a height of 15
Answers: 2
You know the right answer?
Liz's math test included a survey question asking how many hours students spent studying for the tes...
Questions


History, 10.02.2021 01:30

Mathematics, 10.02.2021 01:30

Mathematics, 10.02.2021 01:30
English, 10.02.2021 01:30
History, 10.02.2021 01:30
History, 10.02.2021 01:30
Mathematics, 10.02.2021 01:30

Mathematics, 10.02.2021 01:30
Mathematics, 10.02.2021 01:30
Mathematics, 10.02.2021 01:30
Mathematics, 10.02.2021 01:30


