
Mathematics, 21.02.2021 18:30 sandy2597
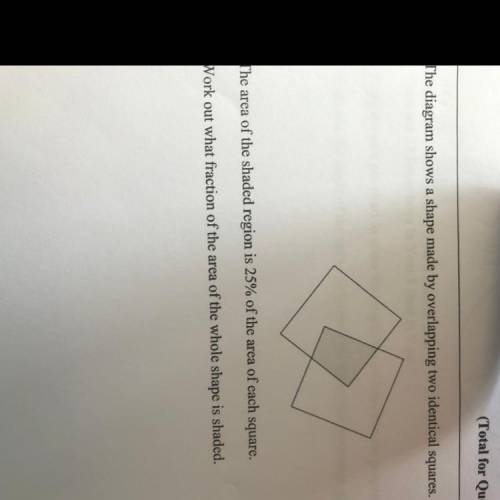
This diagram shows a shape made by overlapping two identical squares. The area of the shaded region is 25% of the area of each square. Work out what fraction of the area of the whole shape is shaded

Answers: 1


Another question on Mathematics
Mathematics, 21.06.2019 16:00
What is the quadric regression equation that fits these data
Answers: 1
Mathematics, 21.06.2019 17:10
The frequency table shows a set of data collected by a doctor for adult patients who were diagnosed with a strain of influenza. patients with influenza age range number of sick patients 25 to 29 30 to 34 35 to 39 40 to 45 which dot plot could represent the same data as the frequency table? patients with flu
Answers: 2
Mathematics, 21.06.2019 19:00
Define multiplicative inverse. give an example of a number and its multiplicative inverse.
Answers: 1
Mathematics, 21.06.2019 20:30
Is the point (0, 8) on the x-axis or y-axis? how do you know?
Answers: 2
You know the right answer?
This diagram shows a shape made by overlapping two identical squares. The area of the shaded region...
Questions
Mathematics, 15.02.2021 09:30


Mathematics, 15.02.2021 09:30

Mathematics, 15.02.2021 09:30

English, 15.02.2021 09:30

Social Studies, 15.02.2021 09:30

World Languages, 15.02.2021 09:30
English, 15.02.2021 09:30

Mathematics, 15.02.2021 09:30


