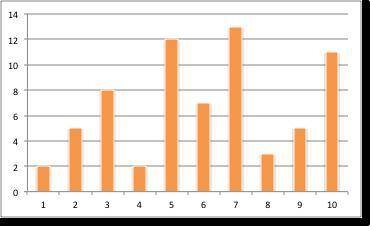
What can be concluded from the graph shown here?
a. The Data is clumped to the left.
b. The D...

Mathematics, 21.02.2021 22:30 ptrlvn01
What can be concluded from the graph shown here?
a. The Data is clumped to the left.
b. The Data is fairly evenly distributed.
c. The Data is clumped to the right
d. Nothing can be determined from this graph.


Answers: 3


Another question on Mathematics


Mathematics, 21.06.2019 16:20
The lengths of nails produced in a factory are normally distributed with a mean of 4.91 centimeters and a standard deviation of 0.05 centimeters. find the two lengths that separate the top 4% and the bottom 4%. these lengths could serve as limits used to identify which nails should be rejected. round your answer to the nearest hundredth, if necessary.
Answers: 3

Mathematics, 21.06.2019 16:30
If g(x) is an odd function, which function must be an even function?
Answers: 3

Mathematics, 21.06.2019 18:20
Inez has a phone card. the graph shows the number of minutes that remain on her phone card a certain number of days.
Answers: 2
You know the right answer?
Questions

Mathematics, 09.10.2020 21:01

Health, 09.10.2020 21:01

History, 09.10.2020 21:01


Mathematics, 09.10.2020 21:01


Mathematics, 09.10.2020 21:01


