
Mathematics, 22.02.2021 06:30 acesmith
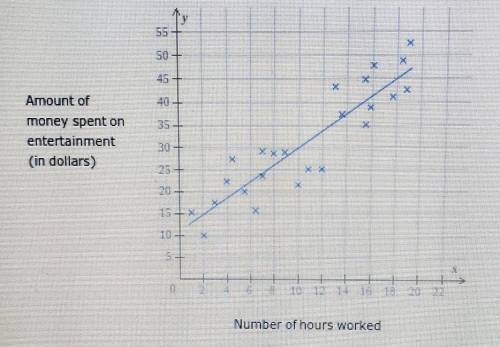
The scatter plot below shows the number of hours worked, x, and the amount of money spent on entertainment, y, by each of 24 students.
Use the equation of the line of best fit, y=1.88x + 11.24, to answer the questions below.
Give exact answers, not rounded approximations.
a). What is the predicated amount of money spent on entertainment for a student who works 10 hours?
b). What is the predicted amount of money spent on entertainment for a student who doesn't work any hours?
c.) For an increase of one hour in time worked, what is the predicted increase in the amount of money spent on entertainment?

Answers: 3


Another question on Mathematics
Mathematics, 21.06.2019 18:00
List the sides of δrst in in ascending order (shortest to longest) if: m∠r =x+28°, m∠s = 2x+16°, and m∠t = x+12°
Answers: 1
Mathematics, 21.06.2019 20:00
Use the elimination method to solve the systems of equations.choose the correct ordered pair. 7x+4y=39
Answers: 1
Mathematics, 21.06.2019 22:30
Which of the following circles have their centers in the third quadrant? check all that apply.
Answers: 1
You know the right answer?
The scatter plot below shows the number of hours worked, x, and the amount of money spent on enterta...
Questions


Social Studies, 08.10.2019 18:00


Mathematics, 08.10.2019 18:00

English, 08.10.2019 18:00
History, 08.10.2019 18:00
Mathematics, 08.10.2019 18:00
Mathematics, 08.10.2019 18:00

Biology, 08.10.2019 18:00
History, 08.10.2019 18:00
English, 08.10.2019 18:00
Mathematics, 08.10.2019 18:00


