
Mathematics, 22.02.2021 18:50 meli6552
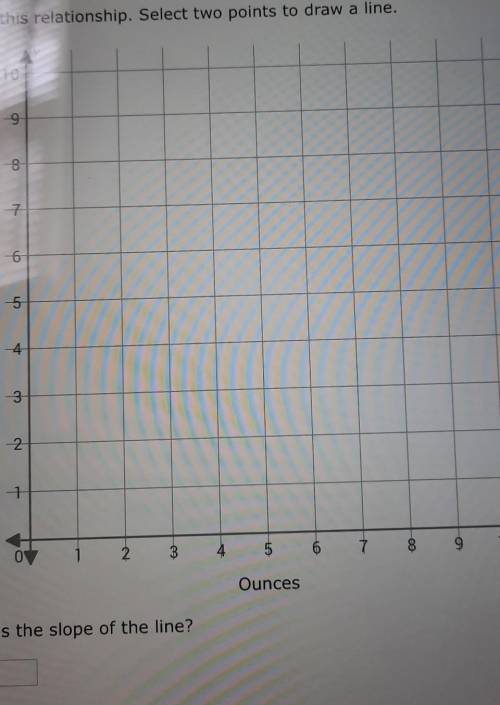
Latrell wants to fill his water bottle between classes, but the water fountain next to his classroom is frustratingly slow. It takes Latrell 5 seconds to get each ounce of water in his bottle. There is a proportional relationship between the amount of water (in ounces) Latrell puts in his water bottle, x, and how long in seconds) it takes to get that amount, y. Graph this relationship. Select two points to draw a line. what is the slope of the line? _

Answers: 1


Another question on Mathematics
Mathematics, 21.06.2019 13:00
Find csc x if sin x + cot x cos x =√3 a. 9 b. 3 c. √(3)/2 d. √(3)
Answers: 1
Mathematics, 21.06.2019 13:30
In the equations, a and b represent the price per night for a room in hotel a and hotel b, respectively, w weeks after september 1 last autumn. what was the price per night in hotel a when it was equal to the price per night in hotel b? a = 240 − 20w b = 320 − 30w
Answers: 1
Mathematics, 21.06.2019 15:00
What is the slope simplify your answer and write it as a proper fraction, improper fraction, or integer
Answers: 3
Mathematics, 21.06.2019 16:00
Part one: measurements 1. measure your own height and arm span (from finger-tip to finger-tip) in inches. you will likely need some from a parent, guardian, or sibling to get accurate measurements. record your measurements on the "data record" document. use the "data record" to you complete part two of this project. name relationship to student x height in inches y arm span in inches archie dad 72 72 ginelle mom 65 66 sarah sister 64 65 meleah sister 66 3/4 67 rachel sister 53 1/2 53 emily auntie 66 1/2 66 hannah myself 66 1/2 69 part two: representation of data with plots 1. using graphing software of your choice, create a scatter plot of your data. predict the line of best fit, and sketch it on your graph. part three: the line of best fit include your scatter plot and the answers to the following questions in your word processing document 1. 1. which variable did you plot on the x-axis, and which variable did you plot on the y-axis? explain why you assigned the variables in that way. 2. write the equation of the line of best fit using the slope-intercept formula $y = mx + b$. show all your work, including the points used to determine the slope and how the equation was determined. 3. what does the slope of the line represent within the context of your graph? what does the y-intercept represent? 5. use the line of best fit to you to describe the data correlation.
Answers: 2
You know the right answer?
Latrell wants to fill his water bottle between classes, but the water fountain next to his classroom...
Questions

Social Studies, 22.12.2019 22:31

Geography, 22.12.2019 22:31
Mathematics, 22.12.2019 22:31

Mathematics, 22.12.2019 22:31
Social Studies, 22.12.2019 22:31
History, 22.12.2019 22:31
Mathematics, 22.12.2019 22:31
Mathematics, 22.12.2019 22:31

Mathematics, 22.12.2019 22:31
Social Studies, 22.12.2019 22:31

Biology, 22.12.2019 22:31


