
Mathematics, 22.02.2021 19:00 2021danaejalang
1. The lunch program at Blake Middle School is being revised to align with the new nutritional standards that reduce calories and increase servings of fruits and vegetables. The administration decided to do a census of all students at Blake Middle School by giving a survey to all students about the school lunches. http://frac. org/federal-foodnutrition-programs/ school-breakfast-program/school-mea l-nutrition-standards a. Name some questions that you would include in the survey. Explain why you think those questions would be important to ask. b. Read through the paragraph below that describes some of the survey results. Then, identify the population characteristics and the sample statistics. About 3 4of the students surveyed eat the school lunch regularly. The median number of days per month that students at Blake Middle School ate a school lunch was 18 days. 36% of students responded that their favorite fruit is bananas. The survey results for Tanya’s seventh-grade homeroom showed that the median number of days per month that her classmates ate lunch at school was 22, and only 20% liked bananas. The fiesta salad was approved by 78% of the group of students who tried it, but when it was put on the lunch menu, only 40% of the students liked it. Of the seventh graders as a whole, 73% liked spicy jicama strips, but only 2 out of 5 of all the middle school students liked them. 2. For each of the following questions, (1) describe how you would collect data to answer the question, and (2) describe whether it would result in a sample statistic or a population characteristic. a. Where should the eighth-grade class go for its class trip? b. What is the average number of pets per family for families that live in your town? c. If people tried a new diet, what percentage would have an improvement in cholesterol reading? d. What is the average grade point of students who got accepted to a particular state university? e. What is a typical number of home runs hit in a particular season for major league baseball players?

Answers: 2


Another question on Mathematics
Mathematics, 21.06.2019 20:30
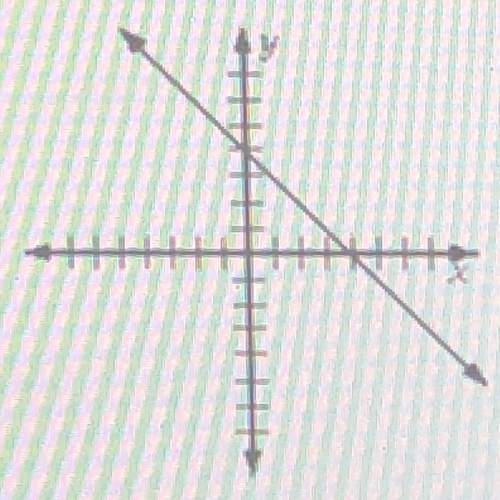
Which shows the graph of the solution set of 3y – 2x > –18?
Answers: 1
Mathematics, 21.06.2019 20:40
Sh what is the value of x? ox= 2.25 x = 11.25 ox= x = 22 1 (2x + 10) seo - (6x + 1) -- nie
Answers: 3
Mathematics, 21.06.2019 23:00
The equation shown below represents function f. f(x)= -2x+5 the graph shown below represents function g. which of the following statements is true? a. over the interval [2, 4], the average rate of change of f is the same as the average rate of change of g. the y-intercept of function f is less than the y-intercept of function g. b. over the interval [2, 4], the average rate of change of f is greater than the average rate of change of g. the y-intercept of function f is greater than the y-intercept of function g. c. over the interval [2, 4], the average rate of change of f is the same as the average rate of change of g. the y-intercept of function f is greater than the y-intercept of function g. d. over the interval [2, 4], the average rate of change of f is less than the average rate of change of g. the y-intercept of function f is the same as the y-intercept of function g.
Answers: 1
You know the right answer?
1. The lunch program at Blake Middle School is being revised to align with the new nutritional stand...
Questions

English, 18.07.2019 07:50

Mathematics, 18.07.2019 07:50

History, 18.07.2019 07:50
Mathematics, 18.07.2019 07:50
Mathematics, 18.07.2019 07:50

Arts, 18.07.2019 07:50

World Languages, 18.07.2019 07:50
Mathematics, 18.07.2019 07:50

Mathematics, 18.07.2019 07:50
Health, 18.07.2019 07:50

Social Studies, 18.07.2019 07:50


