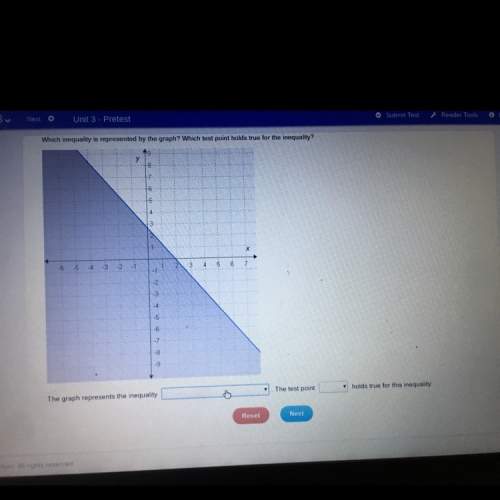
The graph represents the number y of visitors to a new art gallery after 3 months.
Visitors
A...

Mathematics, 22.02.2021 23:50 christopherschool04
The graph represents the number y of visitors to a new art gallery after 3 months.
Visitors
Art Gallery
УГ
175
150
125
3, 135)
100
(2,90)
75
50A(1, 60)
25(, 40)
0
0 1 2 3 4 5 6 7
Month
A
Write an exponential function that represents this situation.
y
Approximate the number of visitors, to the nearest person, after 5 months.
About visitors

Answers: 2


Another question on Mathematics
Mathematics, 21.06.2019 16:00
Ernest is purchasing a $175,000 home with a 30-year mortgage. he will make a $15,000 down payment. use the table below to find his monthly pmi payment.
Answers: 2
Mathematics, 21.06.2019 17:50
The length and width of a rectangle are consecutive even integers the area of the rectangle is 120 squares units what are the length and width of the rectangle
Answers: 1
Mathematics, 21.06.2019 18:00
Solve this and show you’re work step by step ! -5 3/4+3h< 9 1/4 -
Answers: 1
Mathematics, 22.06.2019 00:00
Cd is the perpendicular bisector of both xy and st, and cy=20. find xy.
Answers: 1
You know the right answer?
Questions

Spanish, 25.02.2021 05:50
Mathematics, 25.02.2021 05:50

Social Studies, 25.02.2021 05:50


English, 25.02.2021 05:50
Mathematics, 25.02.2021 05:50
English, 25.02.2021 05:50
Mathematics, 25.02.2021 05:50


Chemistry, 25.02.2021 05:50
Mathematics, 25.02.2021 05:50
Mathematics, 25.02.2021 05:50
Mathematics, 25.02.2021 05:50


