
Mathematics, 23.02.2021 02:10 fatboi82
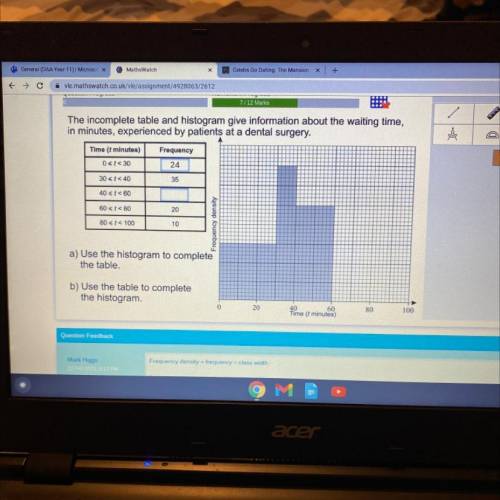
The incomplete table and histogram give information about the waiting time,
in minutes, experienced by patients at a dental surgery.
Time (t minutes)
Frequency
0
30
35
40 t<60
60
20
80 t < 100
10
a) Use the histogram to complete
the table.
b) Use the table to complete
the histogram.
0
20
40
60
Time (t minutes)
80
100
Question Feedback

Answers: 3


Another question on Mathematics
Mathematics, 21.06.2019 16:00
Successful implementation of a new system is based on three independent modules. module 1 works properly with probability 0.96. for modules 2 and 3, these probabilities equal 0.95 and 0.90. compute the probability that at least one of these three modules fails to work properly.
Answers: 2
Mathematics, 21.06.2019 16:30
The average human heart beats 1.15 \cdot 10^51.15⋅10 5 1, point, 15, dot, 10, start superscript, 5, end superscript times per day. there are 3.65 \cdot 10^23.65⋅10 2 3, point, 65, dot, 10, start superscript, 2, end superscript days in one year.how many times does the heart beat in one year? write your answer in scientific notation, and round to one decimal place.
Answers: 1
Mathematics, 21.06.2019 20:30
If you are dealt 4 cards from a shuffled deck of 52? cards, find the probability that all 4 cards are diamondsdiamonds.
Answers: 1
Mathematics, 22.06.2019 01:00
Arestaurant offers delivery for their pizzas. the total cost the customer pays is the price of the pizzas, plus a delivery fee. one customer pays $23 to have 2 pizzas delivered. another customer pays $59 for 6 pizzas. how many pizzas are delivered to a customer who pays $86?
Answers: 1
You know the right answer?
The incomplete table and histogram give information about the waiting time,
in minutes, experienced...
Questions


English, 25.07.2020 23:01
Mathematics, 25.07.2020 23:01


