EVIOUS
14v
Next →
Pretest: Statistics
Submit Test
Reader Tools
Info
• Save & EU
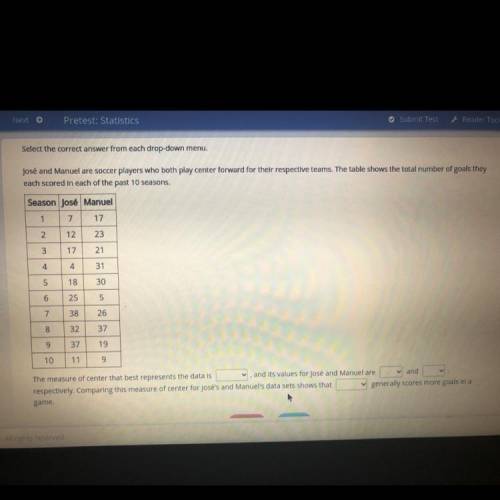
Select the correct answer from each drop-down menu.
José and Manuel are soccer players who both play center forward for their respective teams. The table shows the total number of goals they
each scored in each of the past 10 seasons.
Season José Manuel
1
7
17
2
12
23
3
17
21
4
4
31
5
18
30
6
25
5
7
38
26
8
32
37
9
37
19
10
11
9
The measure of center that best represents the data is
and its values for José and Manuel are and
respectively. Comparing this measure of center for José's and Manuel's data sets shows that
generally scores more goals in a
game
Es reserved
Choose the linear inequality that describes the graph. the gray area represents the shaded region. a: y ≤ –4x – 2 b: y > –4x – 2 c: y ≥ –4x – 2 d: y < 4x – 2
Acolony contains 1500 bacteria. the population increases at a rate of 115% each hour. if x represents the number of hours elapsed, which function represents the scenario? f(x) = 1500(1.15)" f(x) = 1500(115) f(x) = 1500(2.15) f(x) = 1500(215)
No commitments. Cancel anytime. All pricing is in US dollars (USD). The subscriptoin renews automaticaly until you cancel. For more information read our Terms of use & Privacy Policy