Mathematics, 23.02.2021 19:40 kathlynskare06
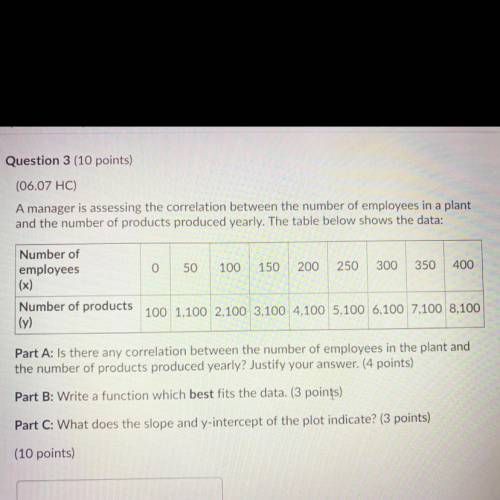
A manager is assessing the correlation between the number of employees in a plant
and the number of products produced yearly. The table below shows the data:
Number of
employees
(x)
0
50
100
150
200
250
300
350
400
Number of products
(y)
100 1,100 2,100 3,100 4,100 5,100 6,100 7,100 8,100
Part A: Is there any correlation between the number of employees in the plant and
the number of products produced yearly? Justify your answer. (4 points)
Part B: Write a function which best fits the data. (3 points)
Part C: What does the slope and y-intercept of the plot indicate? (3 points)


Answers: 3


Another question on Mathematics

Mathematics, 21.06.2019 18:30
Players on the school soccer team are selling candles to raise money for an upcoming trip. each player has 24 candles to sell. if a player sells 4 candles a profit of$30 is made. if he sells 12 candles a profit of $70 is made
Answers: 2


Mathematics, 21.06.2019 22:00
Percent increase and decrease. original number: 45 new number: 18
Answers: 1

Mathematics, 21.06.2019 23:30
Write the percent as a fraction or mixed number in simplest form. 0.8%
Answers: 2
You know the right answer?
A manager is assessing the correlation between the number of employees in a plant
and the number of...
Questions


Mathematics, 13.05.2021 23:20


Mathematics, 13.05.2021 23:20


Mathematics, 13.05.2021 23:20

Chemistry, 13.05.2021 23:20


Mathematics, 13.05.2021 23:20


