
Mathematics, 23.02.2021 21:50 alishbaqadeer1
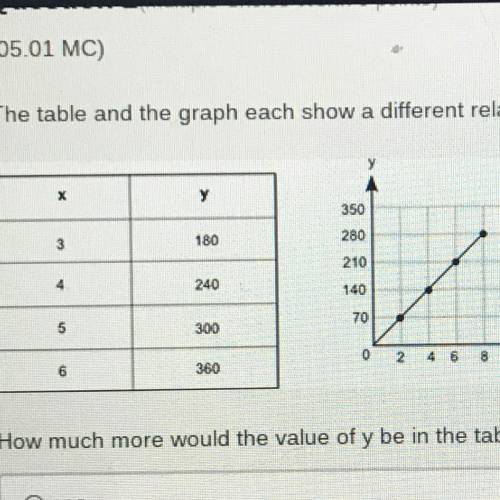
Table and a graph each show me different relationship between The same two variables, X and Y: how much more would the value be of Y be in the table then it's table on the graph X=11?

Answers: 3


Another question on Mathematics
Mathematics, 21.06.2019 16:20
What are the soultion(s) to the quadratic equation 40- x^2=0
Answers: 1
Mathematics, 21.06.2019 20:00
Afamily has five members. a mom, a dad, two sisters, & a brother. the family lines up single file. what is the probabillity that the mom is at the front of the line
Answers: 1
Mathematics, 21.06.2019 21:30
Two rectangular prisms have the same volume. the area of the base of the blue prism is 418 4 1 8 square units. the area of the base of the red prism is one-half that of the blue prism. which statement is true?
Answers: 3
You know the right answer?
Table and a graph each show me different relationship between The same two variables, X and Y:
how...
Questions
SAT, 29.12.2021 01:00

History, 29.12.2021 01:00
SAT, 29.12.2021 01:00


Health, 29.12.2021 01:00

SAT, 29.12.2021 01:00


