HELP Me please
4) As part of an economics assignment, high school students were asked
to keep...

Mathematics, 24.02.2021 01:00 mia6291
HELP Me please
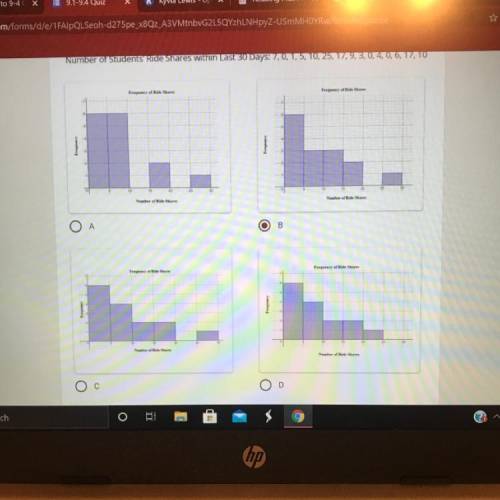
4) As part of an economics assignment, high school students were asked
to keep track of the number of times within the last 30 days that they
used ride-sharing for transportation. The students' responses are shown
below. Which of the following histograms correctly demonstrates the
frequency of ride shares reported by the students? (If you are unable to
see the intervals on the axis, the x-axis is spaced out by increments of 5
and the y-axis is spaced out by increments of 1.) *
Number of Students' Ride Shares within Last 30 Days: 7,0,1,5, 10, 25, 17, 9, 3, 0, 4,0, 6, 17, 10

Answers: 2


Another question on Mathematics
Mathematics, 21.06.2019 14:50
On a piece of paper, graph . then determine which answer choice matches the graph you drew
Answers: 1
Mathematics, 21.06.2019 15:20
Which equation represents a circle with a center at (–3, –5) and a radius of 6 units? (x – 3)2 + (y – 5)2 = 6 (x – 3)2 + (y – 5)2 = 36 (x + 3)2 + (y + 5)2 = 6 (x + 3)2 + (y + 5)2 = 36
Answers: 3
Mathematics, 21.06.2019 18:00
Lv beethoven software supplies customized software to a managed healthcare system. lv beethoven software's costs for the software is $1,723,000. lv beethoven software sells the software to the healthcare system for $3,816,981.10. overhead expenses are estimated at 47% of the selling price. what is lv beethoven software's net profit to the nearest dollar?
Answers: 1
You know the right answer?
Questions

Health, 06.07.2019 08:00
Mathematics, 06.07.2019 08:00


Mathematics, 06.07.2019 08:00

Computers and Technology, 06.07.2019 08:00
Mathematics, 06.07.2019 08:00

Business, 06.07.2019 08:00


Mathematics, 06.07.2019 08:00


