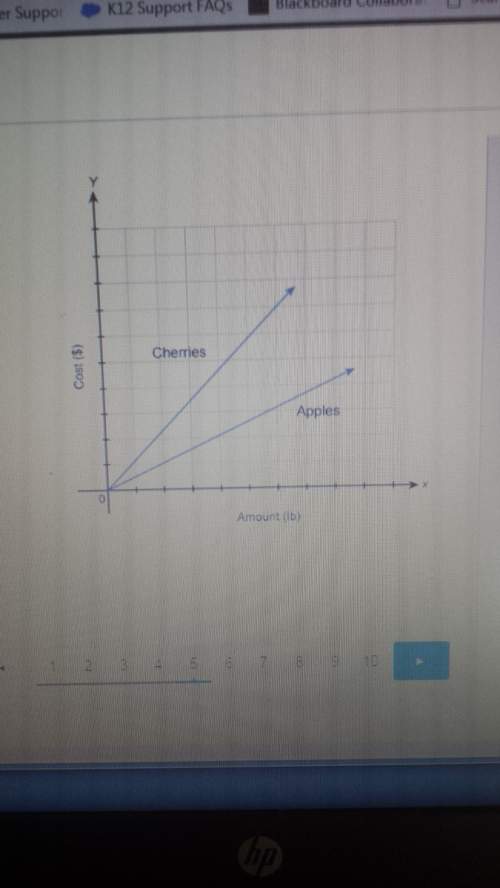
The graph shows the cost for cherries and apples
a) the unit cost for cerries is greater...

Mathematics, 30.11.2019 08:31 taykola
The graph shows the cost for cherries and apples
a) the unit cost for cerries is greater because the slope is greater than the slope for apples
b) the unit cost for apples is greater because the slope is greater than the slope for cherries
c) the unit cost for cherries is greater because the slope is less than the apples
d) the unit cost for apples is greater because the slope is less than the slope for cherries

Answers: 3


Another question on Mathematics
Mathematics, 21.06.2019 17:30
What is the range of the relation in the table below? x y –2 0 –1 2 0 4 1 2 2 0
Answers: 3
Mathematics, 21.06.2019 19:30
According to the data set, where should the upper quartile line of the box plot be placed?
Answers: 1
Mathematics, 21.06.2019 21:00
Circle a has a diameter of 7 inches, a circumference of 21.98 inches, and an area of 38.465 square inches. the diameter of circle b is 6 inches, the circumference is 18.84 inches, and the area is 28.26 square inches. part a: using the formula for circumference, solve for the value of pi for each circle. (4 points) part b: use the formula for area and solve for the value of pi for each circle. (4 points)
Answers: 2
You know the right answer?
Questions

Mathematics, 02.02.2021 02:50
Mathematics, 02.02.2021 02:50


Health, 02.02.2021 02:50


