
Mathematics, 24.02.2021 18:00 andrewbao999
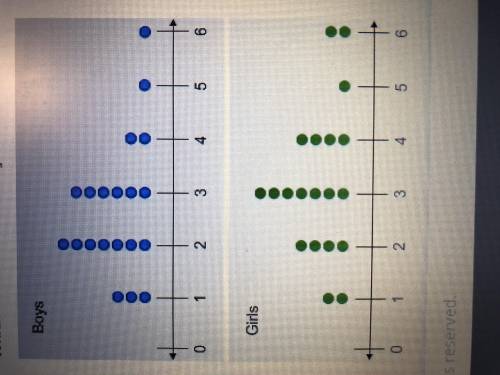
The dot plot shows the number of classes per semester that a group of boys and girls have chosen to take in their freshman year of college. Which statements correctly describe the two data sets?
A. The difference of the means is 1.5.
B. The difference of the means is 0.5.
C. The difference of the means is about one-third the mean absolute deviation of either data set. (This answer was not of the correct ones the first time I took it)
D. The difference of the means is 1.
E. The difference of the means is about one-half the mean absolute deviation of either data set.

Answers: 2


Another question on Mathematics
Mathematics, 21.06.2019 18:00
The price of an item has been reduced by 30%. the original price was $30. what is the price of the item now ?
Answers: 1
Mathematics, 21.06.2019 20:40
How is the equation of this circle written in standard form? x2 + y2 - 6x + 14y = 142 a) (x - 3)2 + (y + 7)2 = 200 b) (x+ 3)2 + (y - 7)2 = 200 (x - 6)2 + (y + 14)2 = 142 d) (x+6)2 + (y- 14)2 = 142
Answers: 1
Mathematics, 21.06.2019 21:00
Check all that apply. f is a function. f is a one-to-one function. c is a function. c is a one-to-one function.
Answers: 3
Mathematics, 22.06.2019 00:30
What should be done to both sides of the equation in order to solve -5m = -40? a) multiply by -5. b) divide by -5. c) multiply by -40. d) divide by -40.
Answers: 2
You know the right answer?
The dot plot shows the number of classes per semester that a group of boys and girls have chosen to...
Questions


Mathematics, 27.11.2020 05:10

Mathematics, 27.11.2020 05:10


English, 27.11.2020 05:10
Geography, 27.11.2020 05:10
English, 27.11.2020 05:10
English, 27.11.2020 05:10

Computers and Technology, 27.11.2020 05:10
Mathematics, 27.11.2020 05:20
Mathematics, 27.11.2020 05:20
Mathematics, 27.11.2020 05:20


