
Mathematics, 24.02.2021 22:30 mathman2428
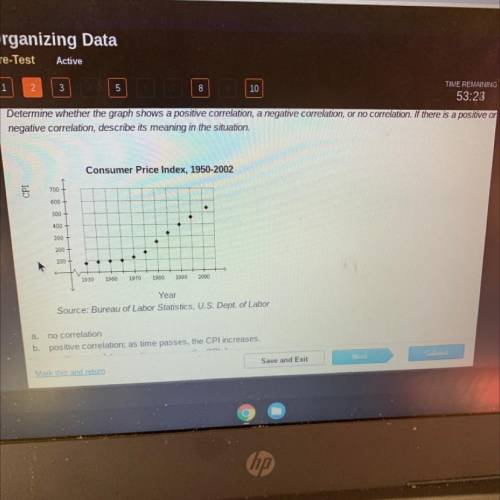
HURRY ANSWER Determine whether the graph shows a positive correlation, a negative correlation, or no correlation. If there is a positive on
negative correlation, describe its meaning in the situation.
Consumer Price Index, 1950-2002
700
600+
500
400
300
200+
100
1950
1960
1970
1980
1990
2000
Year
Source: Bureau of Labor Statistics, U. S. Dept. of Labor
a. no correlation
b. positive correlation; as time passes, the CPI increases.
C. positive correlation as time passes

Answers: 1


Another question on Mathematics
Mathematics, 21.06.2019 12:40
What is the length of bc ? enter your answer in the box.bc =
Answers: 1
Mathematics, 21.06.2019 17:30
Find the exact value of each of the following. in each case, show your work and explain the steps you take to find the value. (a) sin 17π/6 (b) tan 13π/4 (c) sec 11π/3
Answers: 2
Mathematics, 21.06.2019 22:30
Which expressions equal 9 when x=4 and y=1/3 a. x2+6y b. 2x + 3y c. y2-21x d. 5 (x/2) -3y e. 3x-9y
Answers: 2
Mathematics, 21.06.2019 23:30
Which of the following statements would be sufficient to prove that parallelograms pqrs is a rectangle ?
Answers: 2
You know the right answer?
HURRY ANSWER Determine whether the graph shows a positive correlation, a negative correlation, or no...
Questions

English, 26.02.2021 19:10

Arts, 26.02.2021 19:10

Biology, 26.02.2021 19:10

Physics, 26.02.2021 19:10

History, 26.02.2021 19:10

Social Studies, 26.02.2021 19:10

History, 26.02.2021 19:10
Mathematics, 26.02.2021 19:10
Mathematics, 26.02.2021 19:10


