
Mathematics, 25.02.2021 21:20 Brightcord9679
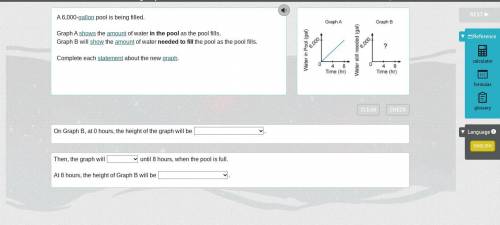
A 6,000-gallon pool is being filled.
Graph A shows the amount of water in the pool as the pool fills.
Graph B will show the amount of water needed to fill the pool as the pool fills.
Complete each statement about the new graph.
On Graph B, at 0 hours, the height of the graph will be
at 0 gallons
at 3000 gallons
at 6000 gallons
Then, the graph will
increase, decrease, or stay level
until 8 hours, when the pool is full.
At 8 hours, the height of Graph B will be at
0 gallons
3000 gallons
6000 gallons

Answers: 3


Another question on Mathematics
Mathematics, 21.06.2019 16:00
Leo has b boxes of pencils. each box contains 6 pencils. he has a total of 42 pencils. the equation that represents this situation the value of b that makes the equation true the first one is b+6=42,6b=42,b=42+6,or 42b=6 the second one are 7,836 48
Answers: 3
Mathematics, 21.06.2019 22:30
Shannon drove for 540 minutes. if she traveled 65 miles per hour,how many total miles did she travel?
Answers: 2
Mathematics, 22.06.2019 00:30
Find the length of the radius of a circle with the center at -7+2i and a point in the circle at 33+11i
Answers: 1
You know the right answer?
A 6,000-gallon pool is being filled.
Graph A shows the amount of water in the pool as the pool fill...
Questions


