Mathematics, 25.02.2021 22:00 ANCHUXIA
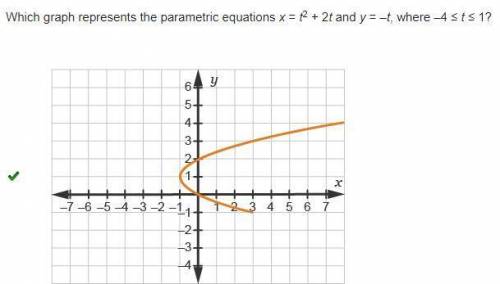
Which graph represents the parametric equations x = t2 + 2t and y = –t, where –4 ≤ t ≤ 1? ANSWER: A


Answers: 1


Another question on Mathematics

Mathematics, 21.06.2019 18:00
The estimated number of people to attend the last bengals game of the season was 2000. the actual number of fans attending was 1200. by what percent did the estimate differ from the actual?
Answers: 3

Mathematics, 21.06.2019 18:00
What can you determine about the solutions of this system
Answers: 1


Mathematics, 21.06.2019 21:30
Three people are traveling and need to exchange the currency of their native country for the currency of the country they are visiting. drag each exchange to the category that shows the ratio of currencies in that exchange.
Answers: 2
You know the right answer?
Which graph represents the parametric equations x = t2 + 2t and y = –t, where –4 ≤ t ≤ 1?
ANSWER: A...
Questions

Computers and Technology, 24.06.2021 16:40


Mathematics, 24.06.2021 16:40

Social Studies, 24.06.2021 16:40

Biology, 24.06.2021 16:40


Mathematics, 24.06.2021 16:40

Mathematics, 24.06.2021 16:40

Biology, 24.06.2021 16:40


