Item 4
Which inequality is represented by the graph?
y<−3 over 2x -2
y≥−...

Mathematics, 25.02.2021 22:10 erinwebsterrr
Item 4
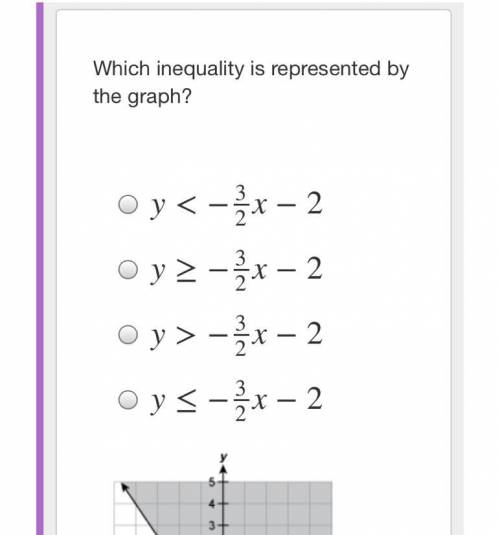
Which inequality is represented by the graph?
y<−3 over 2x -2
y≥−32x−2
y>−32x−2
y≤−32x−2
Coordinate graph showing a range of negative five to five on the x and y axes. A solid line is drawn on the graph, crossing through the points begin ordered pair negative two comma one end ordered pair and begin ordered pair zero comma negative twoend ordered pair. The area above the line is shaded.

Answers: 2


Another question on Mathematics
Mathematics, 21.06.2019 18:30
The monetary value earned for selling goods or services to customers is called a.) revenue b.) assets c.) money d.) accounting
Answers: 2
Mathematics, 21.06.2019 19:00
What is the average diastolic blood pressure for adults
Answers: 2
Mathematics, 21.06.2019 23:00
12 out of 30 people chose their favourite colour as blue caculate the angle you would use for blue on a pie chart
Answers: 1
Mathematics, 22.06.2019 02:00
The statement tan theta= -12/5, csc theta=-13/12, and the terminal point determained by theta is in quadrant two
Answers: 3
You know the right answer?
Questions

Social Studies, 31.08.2021 07:20
Mathematics, 31.08.2021 07:20

Health, 31.08.2021 07:20
Mathematics, 31.08.2021 07:20

Mathematics, 31.08.2021 07:20
Mathematics, 31.08.2021 07:20

Health, 31.08.2021 07:20
Mathematics, 31.08.2021 07:20
Mathematics, 31.08.2021 07:20
Mathematics, 31.08.2021 07:20

Biology, 31.08.2021 07:20
Mathematics, 31.08.2021 07:20


