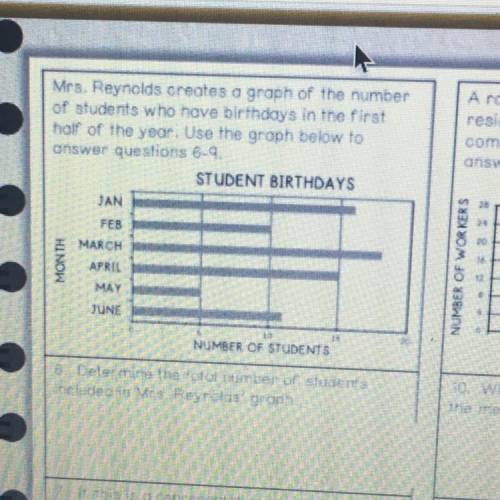
Mrs. Reynolds creates a graph of the number
of students who have birthdays in the first
half...

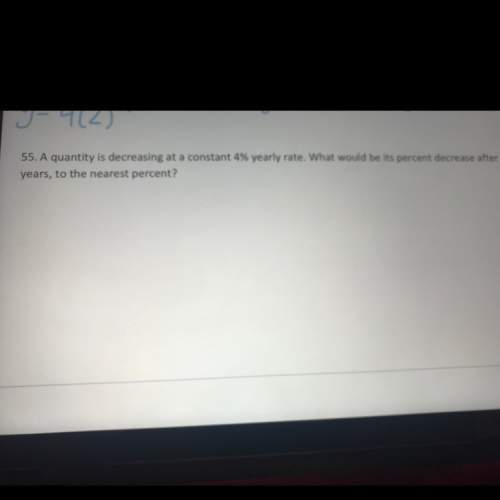
Mathematics, 26.02.2021 01:00 DESI111609
Mrs. Reynolds creates a graph of the number
of students who have birthdays in the first
half of the year. Use the graph below to
answer questions 6-4.
STUDENT BIRTHDAYS
JAN
FEB
NARCH
.
MONTH
APRIL
MAY
JUNE
NUMBER OF STUDENTS
6. Delermine the total number of students
included in Mrs. Reynolds' graph.

Answers: 3


Another question on Mathematics
Mathematics, 21.06.2019 13:30
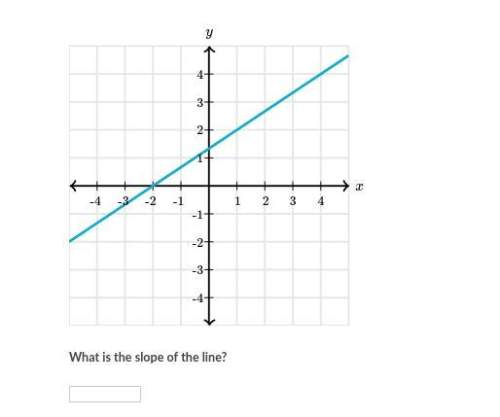
Write an equation of the line given the two points below (write your equation in slope-intercept form, y=mx+b): (-4, 4) and (6, -4)
Answers: 2
Mathematics, 21.06.2019 15:10
Drag each sequence of transformations to the correct location on the table. classify the sequences of transformations based on whether or not they prove the congruency of the shapes by mapping shape i onto shape ii. plz i'll rate u 5 stars need this done for a mastery test
Answers: 1
You know the right answer?
Questions


Biology, 02.06.2021 04:50
Mathematics, 02.06.2021 04:50
Mathematics, 02.06.2021 04:50
Mathematics, 02.06.2021 04:50

Mathematics, 02.06.2021 04:50

History, 02.06.2021 04:50


